Transperth buses
Transperth buses
Transperth’s bus services are divided into geographic contract areas which are periodically subject to competitive tender. This year, the contract areas of Kalamunda, Belmont and Fremantle-Cockburn were re-tendered as two separate contracts (Kalamunda and Fremantle). The new contracts come into force in October 2012 and will reduce the number of contracts from 12 to 11.
As at June 30, 12 contracts were operated by three contractors.
- Path Transit: Morley.
- Swan Transit: Belmont, Canning, Claremont, Kalamunda, Marmion, Midland (including Midland Shuttle), and Southern River.
- Southern Coast Transit: Fremantle-Cockburn (including Fremantle CAT), Joondalup (including Joondalup CAT), Rockingham-Mandurah, and the Perth CAT contract.
In 2011-12, the Transperth bus system operated 291 standard timetabled bus routes and 352 school routes. On a typical weekday this involved operating 13,858 standard and 351 school service trips. Accessible buses are always used on 161 of the standard routes. A bus service frequency of 15 minutes or better is provided all day on most major corridors, with higher frequencies in peak periods.
The year’s developments
In 2011-12, Transperth started implementing a five-year service kilometre growth program, which allowed significant improvements to be made to many services:
- Increased frequency, better peak, off-peak, after-hours and weekend services on Wanneroo Road, Flinders Street and Beaufort Street, between Cannington and Murdoch via Thornlie, and on Route 34
- Introduction of new route 35 in South Perth
- Increased service frequency, better off-peak and weekend services on Mirrabooka feeder routes
- Significant improvements in the Morley, Mirrabooka, Ballajura, Alexander Heights and Warwick areas on Routes 344 and 371
- Improvements to Joondalup Line feeder bus services
- Additional peak period trips and more consistent headways on Alexander Drive, Cambridge Street, Scarborough Beach Road, and to Belmont on Route 37
- Additional peak period trips and more consistent headways on services to Curtin University and the University of Western Australia
- New routes to Ashby, Tapping, Aveley, Baldivis North, Landsdale, Balcatta, Greenwood and between Mirrabooka and Stirling
- Extension of existing routes to Alkimos and Aubin Grove
- Introduction of the new Mandurah Shuttle service
- Investment in routes across the network to improve reliability and legibility.
At balance date, the Transperth bus fleet of 1246 buses was made up of 695 diesel and 551 CNG buses. During the year we took delivery of 90 new low-floor buses. A new contract will deliver 650 diesel buses over a 10-year period.
The fleet includes 151 buses (12.1 per cent) which conform with the Euro5 emissions standard and 502 (40.3 per cent) Euro4s. Euro5 allows for emissions of 1.5 gm/kWh carbon monoxide, 0.46 gm/kWh hydrocarbons, 2.0 g/kWh nitrogen oxides and 2.02 gm/kWh of particulate matter. The Volvo buses meet the Euro5 EEV standard - they are “enhanced environmentally-friendly vehicles” with emissions between Euro5 and the more stringent Euro6 (expected to be the standard by around 2015).
Safety audits and monitoring of Transperth bus contractors continued in line with standard AS 4801-OSH Management Systems. Each depot was audited at least once with other documented site visits throughout the year. These regular audits and inspections have resulted in improved safety management systems and safety focus and ensured that contractors’ LTI (lost time injury) rate continued to be well below the industry standard.
- Swan Transit was re-certified to AS4801 in February 2012, valid to February 2015. Its current LTI rate is 8.0. Swan has also been certified as compliant with ISO 14001 Environmental Management Systems valid to December 2012.
- Path Transit was re-certified to AS4801 in August 2009 valid to August 2012 and has achieved the WorkSafe Platinum Award. Its current LTI rate is 8.52. Path has also been certified as compliant with ISO 14001 Environmental Management Systems, valid to December 2012.
- Southern Coast Transit (SCT) was re-certified to AS4801 in January 2011 valid to January 2014 and has also achieved the WorkSafe Platinum Award. Its current LTI rate is 6.19. SCT has also been certified as compliant with ISO 14001 Environmental Management Systems, valid to January 2014.
A special booth has been provided in each major contract area to ensure that spray painting is carried out in a safe environment. Commissioning has yet to be completed.
In addition to the contractors’ drug and alcohol testing program, Transperth has provided funds to enable testing for synthetic cannabinoids, (Kronic). Testing has been introduced on a trial basis for six months.
Cost of the service
The total cost of operating Transperth bus services in 2011-12 was $385.533 million, up 9.6 per cent from $351.869m in 2010-11. Operating costs rose 10.3 per cent to $326.844m from $296.395m, while annual capital charges (interest and depreciation) rose 5.8 per cent to $58.689m from $55.474m.
The increase in operating cost was due to:
- Fuel (diesel and compressed natural gas) cost increase of about 14 per cent following the introduction of 4.54m additional service kilometres
- Higher bus driver wages - two per cent in July 2011 and another two per cent in January 2012
- A 10.5 per cent increase in payments under the patronage incentive model.
Patronage
Transperth buses: Patronage (millions)
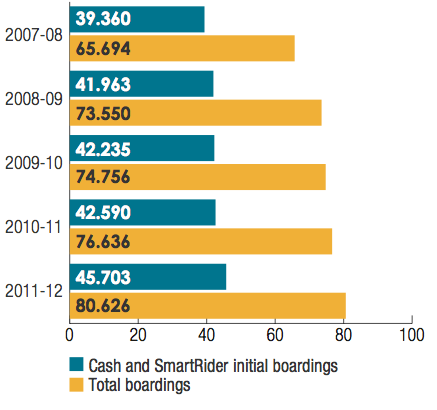
In 2011-12, total boardings on Transperth bus services rose 5.2 per cent to 80.626 million. The previous year’s increase was 2.5 per cent. Cash and SmartRider initial boardings were up 7.3 per cent at 45.703m - a significantly bigger increase than the 0.8 per cent recorded in 2010-11. Fare-paying boardings increased 7.5 per cent to 42.360m. (The lower rate of increase in total boardings reflects a downward revision of the estimate of Perth CAT boardings.)
Seniors, aged and disability pensioners used their free travel entitlement to complete 5.473m total boardings, seven per cent more than in 2010-11.
While all contract areas achieved increases in total boardings, areas with the highest rates of growth were Claremont (10.8 per cent), Midland (9.7 per cent), Rockingham (8.3 per cent), Canning (7.9 per cent), Morley (7.8 per cent), and Belmont (7.1 per cent). Boardings on special event services increased 11.1 per cent to 137,621.
Road congestion, particularly in peak periods in Perth, continues to impact on service reliability and may affect patronage on Transperth bus services.
The higher patronage reflected the expansion of bus services made possible by the 8.5 per cent increase in service kilometres from 53.551 million in 2010-11, to 58.091m. However, average boardings fell. Total boardings per service kilometre fell three per cent to 1.39 from 1.43 in 2010-11.
Passenger satisfaction
Transperth buses: Level of overall customer satisfaction
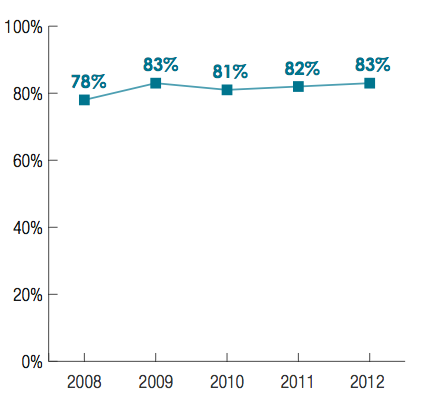
The 2012 PSM showed that 83 per cent of Transperth bus users were satisfied overall with the system, compared with 82 per cent in 2011.
The importance rating of the key service characteristics (other than passenger safety) and their respective levels of satisfaction/dissatisfaction are shown in the accompanying table. In most cases, the ratings show little change from 2011. A significant exception was in respect of “shelter provided at the bus stop” which showed a decrease in the satisfaction rating and an increase in the dissatisfaction rating. In the case of “cost of fares” both the satisfaction and dissatisfaction rating showed a slight improvement.
|
Service characteristic |
Importance rating (%) |
Satisfaction (dissatisfaction) rating (%) |
||
|---|---|---|---|---|
| 2011 | 2012 | 2011 | 2012 | |
|
Punctuality |
68 |
68 |
81 (10) |
81 (8) |
|
Cost of fares |
63 |
66 |
62 (10) |
64 (9) |
|
Shelter provided at the bus stop |
59 |
60 |
77 (15) |
74 (17) |
|
Cleanliness on board |
52 |
57 |
94 (2) |
94 (1) |
|
Service frequency weekdays |
56 |
56 |
72 (17) |
71 (17) |
|
Speed of the trip |
48 |
51 |
92 (3) |
92 (3) |
|
Availability of seats |
54 |
50 |
89 (6) |
90 (6) |
|
Service frequency peak times |
47 |
49 |
73 (16) |
76 (15) |
Passenger safety
In the 2012 PSM, bus users were asked: “How safe do you generally feel from personal interference or threat from other passengers?” The accompanying graph shows the proportion of respondents who “always/usually feel safe” at specified times/locations on the bus network.
Transperth buses: Customer perception of safety
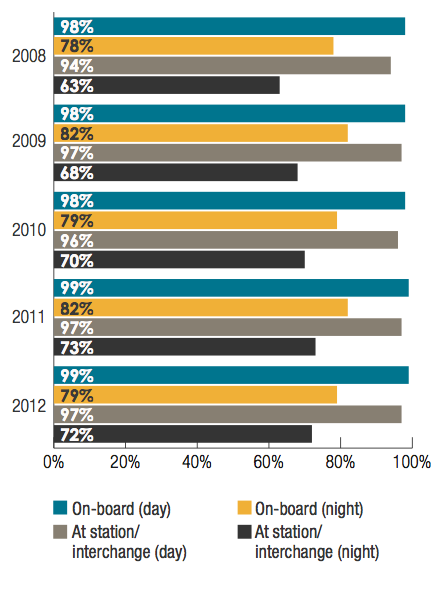
As is the case with trains, virtually all bus patrons feel safe during the day. The ratings for feeling safe on board and at stops/and interchanges at night were 79 per cent and 72 per cent respectively, down on the previous year’s levels.
Transperth has introduced extensive security measures in response to concerns about personal safety expressed by passengers who use our buses and facilities at night. The new CMR monitors CCTV footage from all bus stations 24/7.
Major initiatives for 2012-13
- Significantly upgrade services by introducing the next batch of additional bus service kilometres. Improvements have been prioritised thus:
- Services which cannot pick up additional passengers due to overloading
- Key transport corridors identified by PTA which provide access between key primary and secondary centres to help achieve the planned land use outcomes proposed by the Department of Planning in Directions 2031
- New urban areas developing on the fringes of the metropolitan area
- Commence trial of the diesel-electric hybrid bus