Key service measures
Patronage and services
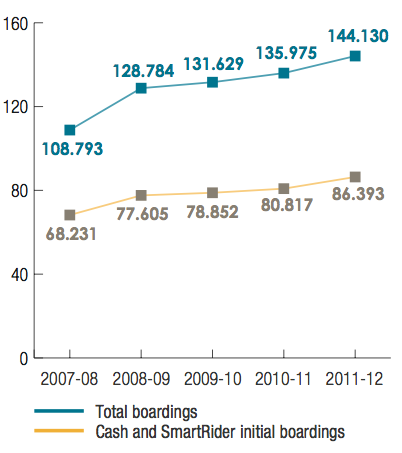
Patronage is reported in three categories:
- Cash and SmartRider initial boardings - cash boardings, SmartRider paid boardings and free travel on SmartRider
- Total initial boardings - cash and SmartRider initial boardings plus free travel on FTZ (free transit zone) services and on CAT (central area transit) services in Perth, Fremantle and Joondalup and on the Midland Shuttle service
- Total boardings - all initial boardings plus transfer boardings.
Patronage on the Transperth system recorded a significantly higher rate of growth in 2011-12 than in the previous two years. Cash and SmartRider initial boardings increased by 6.9 per cent (compared with increases of 2.5 per cent in 2010-11 and 1.6 per cent in 2009-10). Total boardings grew by six per cent (3.3 per cent and 2.2 per cent previously).
Free travel by seniors and pensioners accounted for 8.108 million total boardings, up 6.1 per cent from 2010-11’s 7.642m. Initial boardings increased 4.8 per cent to 4.961m.
Since 2007-08, total boardings have increased 32.5 per cent to 144.130m while cash and SmartRider initial boardings added have 26.6 per cent to 86.393m.
Transperth: Patronage (millions)
Passenger place kilometres represent the total passenger carrying capacity of the Transperth bus, train and ferry network. This metric is based on service kilometres and the average capacity of the fleet.
Transperth: Passenger place kilometres (millions)
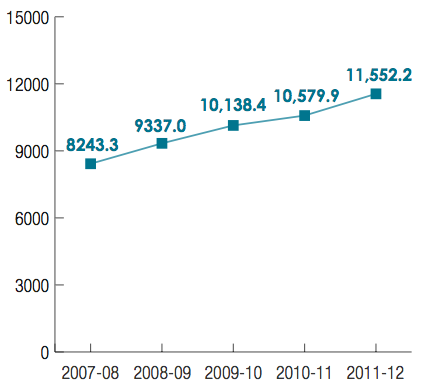
Total capacity provided by Transperth increased by 40.1 per cent between 2007-08 and 2011-12, with the main contributors being the expansion of the train system to Clarkson and Thornlie, the introduction of three and six-car trains and the opening of the Mandurah Line. As a result, rail passenger place kilometres increased by 56.3 per cent to 7192.7m between 2007-08 and 2011-12.
In the past, the contribution of the bus system to the total capacity increase has been relatively modest. However, bus passenger place kilometres increased significantly this year following an 8.5 per cent jump in funding for service kilometres.
Access to public transport: Proportion of Property Street Addresses in the Perth Public Transport Area within 500m of a Transperth stop providing an acceptable level of service
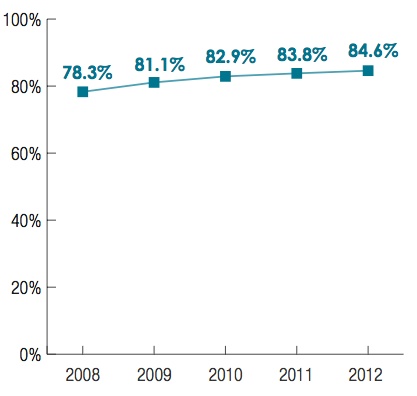
The proportion of PSAs (property street addresses) in the PPTA (Perth public transport area) within walking distance (500 metres) of a Transperth stop or station providing an ASL (acceptable service level) continued to edge higher. An ASL is defined as a 20-minute or better service in the peak-flow direction during the peak, and at least hourly through the core of the day.
Transperth uses GPS (global positioning system) data to determine the exact location of all bus stops and train stations. Access to these facilities is measured against other spatial and scheduling data - in this case PSAs and service timetables.
In 2012, 84.6 per cent of PSAs were within 500m of an ASL Transperth stop, compared with 83.8 per cent previously. The total number of PSAs in the PPTA was 906,184 compared with 876,549 in 2011.
Since 2008, the number of PSAs within walking distance of an ASL stop has increased by 19.4 per cent, from 641,610 to 766,276.
Reliability
Transperth: Service reliability by mode Proportion of services meeting on-time targets
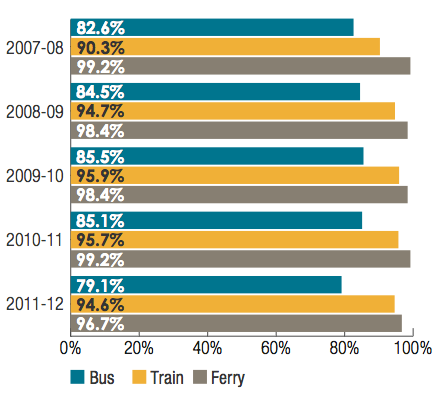
Transperth bus and ferry OTR is measured by the GPS Reporter functionality of the SmartRider ticketing system, while train OTR is measured through the train control system. These technology-based monitoring methods allow more precise data-gathering than the physical checks and manual observations used previously. Based on specified reliability criteria, the OTR targets for the three modes are for 85 per cent (bus), 95 per cent (train) and 98 per cent (ferry). In the year under review, on average 79.1 per cent of bus services, 94.6 per cent of train services, and 96.7 per cent of ferry services arrived on time.
Passenger satisfaction
An independent market research firm commissioned by Transperth carries out the annual Passenger Satisfaction Monitor (PSM) to assess the level of satisfaction/dissatisfaction among passengers in regard to various aspects of Transperth services.
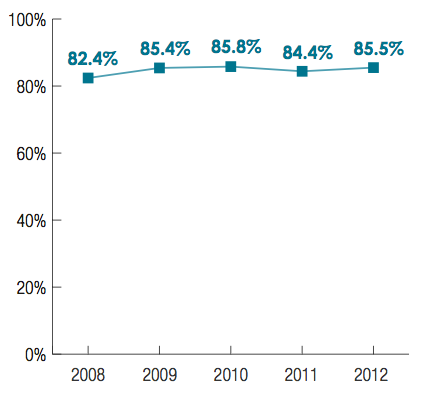
Overall satisfaction with the quality of service on Transperth bus, train and ferry operations (calculated as the weighted average across all modes) increased slightly in 2012. Bus and train satisfaction increased but there was a slight reduction in the level of satisfaction with the ferry service.
Transperth: Level of overall customer satisfaction
Passenger safety
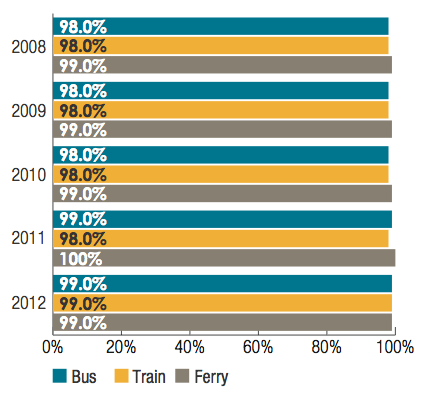
The PSM assesses customer perceptions of safety during the day and at night, both waiting for and aboard the (bus/train/ferry) service. Virtually all passengers feel safe aboard our services during the day.
Transperth: Proportion of respondents who generally feel safe on board during the day
Efficiency
In 2011-12, the average total cost of providing Transperth services increased by 1.8 per cent to $0.544 per passenger kilometre, compared with $0.534 in 2010-11. Total system cost rose 6.5 per cent while passenger kilometres rose 4.6 per cent.
Transperth: Total cost per passenger kilometre (Passenger kilometres: Average trip length to 2007-08 based on zonal distribution of tickets; from 2008-09 based on SmartRider tag-on/tag-off data)
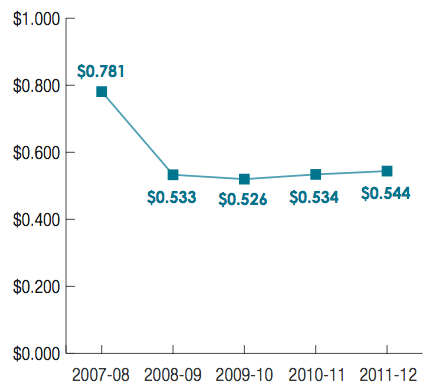
The most significant change over the past few years has been a 31.8 per cent cost reduction ($0.781 down to $0.533) from 2007-08 to 2008-09. This reflects a change in the way the average trip length is determined in calculating passenger kilometres.
Until 2007-08, the average (bus and train) trip length was based on the zonal distribution of ticket sales and validations. From 2008-09, SmartRider tag-on/tag-off data has provided a precise basis for the calculation as it accurately records the length of each SmartRider journey (including individual legs and transfers). The average SmartRider trip length is then applied to cash fares. Estimated trip lengths are applied to boardings on bus services in the FTZ, and on CAT and Midland Shuttle services. (Interestingly, recalculating the 2007-08 figure using SmartRider-based data generates a total cost per passenger kilometre of $0.535, 31.6 per cent lower than the reported figure of $0.781.)
Expenditure and revenue
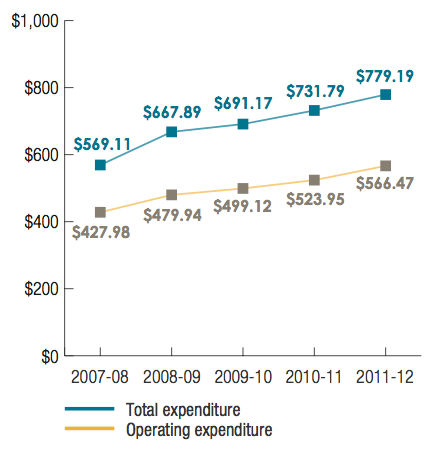
Transperth: Expenditure ($ millions)
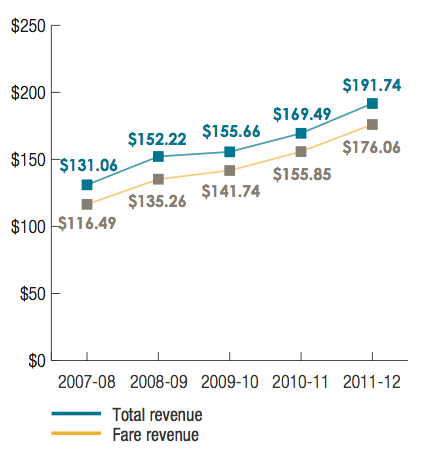
Transperth: Revenue ($ millions)
Total expenditure on Transperth services rose 6.5 per cent to $779.186m. Operating expenditure (excluding capital charges) rose 8.1 per cent from $523.948m in 2010-11, to $566.474m; capital charges (interest and depreciation) rose 2.3 per cent from $207.842m to $212.712m.
Across the modes, bus total costs increased by 9.6 per cent and operating costs by 10.3 per cent; train total costs increased 3.6 per cent and operating costs 5.3 per cent; and ferry total costs increased 6.7 per cent and operating costs 7.5 per cent.
The increase in system costs in 2011-12 was due mainly to:
- Increased labour cost on both bus and train services
- Higher fuel cost on buses and increased railcar energy cost
- The addition of 4.5 million service kilometres (an increase of 8.5 per cent) to total bus service kilometres operated during the year
- One-off mobilisation cost for the start-up of the new train maintenance contract combined with the close-out of the existing works
- An increase in payments under the bus patronage incentive model of 10.5 per cent compared with 2010-11 due to patronage growth.
Transperth’s rising revenue trend continued. Total revenue (which includes income such as advertising and rent as well as fares) increased 13.1 per cent to $191.739m and fare revenue was up 13 per cent at $176.059m. In addition to revenue from cash and SmartRider boardings, fare revenue includes full or part funding for CAT services, contributions for the provision of specific bus services, revenue from joint ticketing for special events (where the public transport fare is included in the price of the event ticket), Commonwealth funding for concession travel by interstate seniors and income from the sale of SmartRider cards.
Though the schedule introduced in July 2011 increased fares by an overall average of 2.6 per cent (standard fares by an average of 3.2 per cent and concession fares by an average one per cent), the increase in fare revenue was due mainly to significant growth in fare-paying boardings (cash boardings, SmartRider paid boardings, and boardings on NightRider and special event services), which rose seven per cent to 81.262m. The increase on our buses was 7.5 per cent (to 42.360m), the highest rate of growth since 2000-01. On our trains, despite a 12.4 per cent drop in special event boardings, fare-paying boardings went up 6.6 per cent (to 38.544m), but the ferry number slipped 2.4 per cent (to 317,000).
This generated revenue of $73.491m (up 12.5 per cent) on buses, $100.536m (up 13.2 per cent) on trains, and $474,000 (up 2.2 per cent) for the ferry service.