Audited Key Performance Indicators
Certification of Key Performance Indicators
For the year ended 30 June 2012
I hereby certify that the key performance indicators are based on proper records, are relevant and appropriate for assisting users to assess the Public Transport Authority’s performance, and fairly represent the performance of the Public Transport Authority of Western Australia for the financial year ended 30 June 2012.

Reece Waldock
Accountable Authority
13 September 2012
Key Performance Indicators
Relationship to Government Strategic Goal
The following table depicts the relationship between the Government’s Goals and the outcomes and services that the PTA provides in order to achieve those goals.
|
Government Strategic Goal |
PTA Outcomes |
PTA Services |
|---|---|---|
|
Results-Based Service Delivery: Greater focus on achieving results in key service delivery areas for the benefit of all Western Australians. |
Accessible, reliable and safe public transport system |
1. Metropolitan and Regional Passenger Services 2. Country Passenger Rail and Road Coach Services 3. Regional School Bus Services |
|
Protection of the long term functionality of the rail corridor and railway infrastructure |
4. Rail Corridor and Residual Freight Issues Management |
Note: The key performance indicators and the variances are calculated based on original source data and the results are reported with rounding to the nearest appropriate decimals.
Measuring Performance
Outcome 1: Accessible, reliable and safe public transport system
Effectiveness Indicators
The PTA’s effectiveness in providing an accessible, reliable and safe public transport system is measured using the following key effectiveness indicators for:
1. Use of public transport
2. Accessible public transport
3. Service reliability
4. Level of overall customer satisfaction
5. Customer perception of safety
6. Level of notifiable safety incidents.
1. Use of Public Transport
The use of public transport is measured by comparing the annual number of passengers carried with the number of service kilometres. Service kilometres are kilometres operated on scheduled passenger services and exclude “non-productive running” IE travelling to or from the depot to commence a service trip or re-positioning to commence another service trip.
The measure indicates the extent to which services provided, as represented by the number of kilometres operated, are being utilised. An increasing trend in the indicator will generally signify that patronage is rising at a rate greater than the rate of increase in service kilometres operated and represents an improvement in effectiveness as well as an increase in the use of public transport.
This effectiveness indicator is applied to each mode of public transport. The indicator is based on total boardings on Transperth services and includes fare-paying boardings plus free travel and transfers. Transfers are boardings which occur either between services within the same mode or between modes during the specified ticket transfer time.
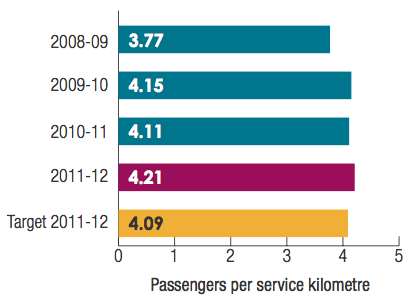
Transperth Bus Services
Total boardings reached 80.626 million in 2011-12 compared to 76.636 million in 2010-11 and the target of 78.032 million, an increase of 5.21 per cent over 2010-11 and 3.32 per cent above the target.
The introduction of new bus services increased service kilometres to 58.091 million kilometres, 4.540 million more than the 53.551 million in 2010-11 and exceeded the target of 56.630 million. This is an increase of 8.48 per cent to 2010-11 and 2.58 per cent to target.
The total number of services (trips) increased by 12.08 per cent from 3.659 million trips to 4.101 million trips in 2011-12.
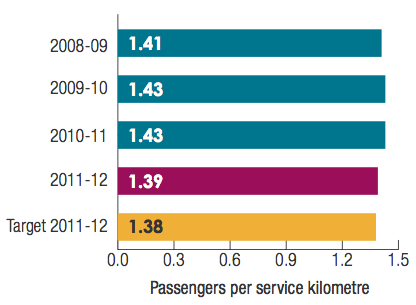
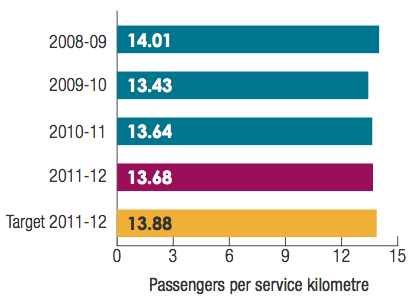
Transperth Train Services
Passengers per service kilometre on Transperth train exceeded the target by 2.98 per cent.
Total boardings reached 63.030 million from 58.868 million in 2010-11 and the target of 61.261 million, an increase of 7.07 per cent from 2010-11 and 2.89 per cent above the target. The increased boardings are due to the increase in population and the benefits of Public Transport over other transport modes.
Train service kilometres recorded 14.965 million kilometres compared to 14.307 million in 2010-11, an increase of 4.60 per cent as a result of bringing four additional railcars into service in April 2011.
Regional Town Bus Services: Intra-town services operate within rural town boundaries, while inter-town services run between regional centres.
a. Intra-Town Services
Passengers per service kilometre were 2.83 per cent less than 2010-11 and 3.11 per cent less than the target.
Total patronage was 2.417 million compared to 2.411 million in 2010-11, an increase of 0.24 per cent.
Service kilometres also increased by 3.16 per cent to 2.512 million kilometres from 2.435 million in 2010-11 due to the inclusion of a new Dunsborough public school bus service in the intra-town service (previously this had been a contract school bus service).
b. Inter-Town Services
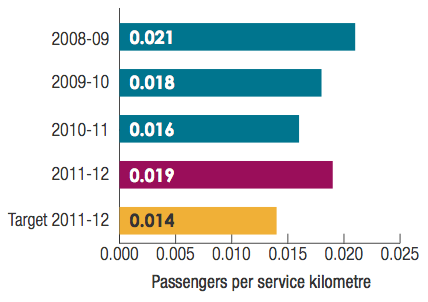
Passengers per service kilometre exceeded the 2010-11 result by 18.79 per cent and the target by 35.77 per cent.
Total patronage was 8,610 compared to 6,532 in 2010-11, an increase of 31.81 per cent with significant increases recorded for Roebourne (41 per cent), Monkey Mia (39 per cent) and Pilbara services (38 per cent).
Service kilometres also increased by 10.97 per cent to 0.453 million kilometres from 0.408 million in 2010-11. The increase in service kilometres was spread across all seven inter-town services.
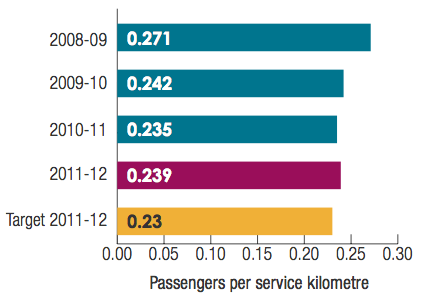
Transperth Ferry Services
Passengers per service kilometre exceeded the 2010-11 result but fell below the target of 2011-12. This is an increase of 0.29 per cent from 2010-11 and 1.44 per cent below the target.
The target was based on projected annual total boardings of 479,000 and 34,500 service kilometres. During the year, ferry boardings increased by 0.51 per cent from 471,338 in 2010-11 to 473,728 but were lower than the target by 1.10 per cent. Annual service kilometres increased slightly from 34,555 kilometres to 34,630 and were 0.38 per cent above the target.
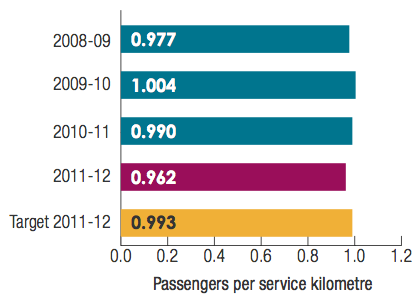
Transwa Rail Services
Passengers per service kilometre exceeded the 2010-11 result and the target for 2011-12. This is an increase of 1.45 per cent from 2010-11 and 3.85 per cent above the target.
There was a marginal (0.27 per cent) increase in service kilometres from 992,669 in 2010-11 to 995,329, albeit 0.34 per cent below the target of 998,706.
The patronage increased by 1.72 per cent from 233,711 in 2010-11 to 237,734 in 2011-12, exceeding the target of 234,722 by 1.28 per cent. This increase was predominantly due to a 10.18 per cent increase in Prospector patronage in 2011-12.
Transwa Road Coach Services
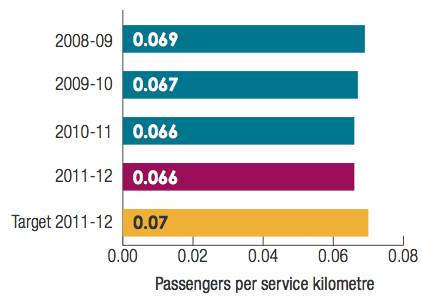
Passengers per service kilometre remained the same as the 2010-11 result and was 6.25 per cent below the 2011-12 target of 0.07.
This is due to a 0.40 per cent decline in patronage from 212,926 in 2010-11 to 212,070 in 2011-12 and a 0.34 per cent increase in service kilometres (from 3.221 million kilometres in 2010-11 to 3.232 million in 2011-12) which is above the target of 3.210 million kilometres by 0.66 per cent.
2. Accessible Public Transport
Accessibility to public transport, in terms of service coverage, is measured as the proportion of Property Street Addresses (PSA) within the Perth Public Transport Area (PPTA) which are within 500 metres of a Transperth stop providing an acceptable level of service. The PPTA defines the core operational areas for Transperth services.
“Acceptable Service Level” (ASL) is defined as an hourly service during the day with at least three trips per hour (IE at 20-minute intervals) in the peak flow direction in the morning and/or afternoon peaks, excluding dedicated school bus services.
The indicator uses PSA data from Landgate and service information and stop location data from the Transperth Route Information System (TRIS).
The measure demonstrates the extent to which the PTA meets its accessibility standards in the Perth metropolitan area.
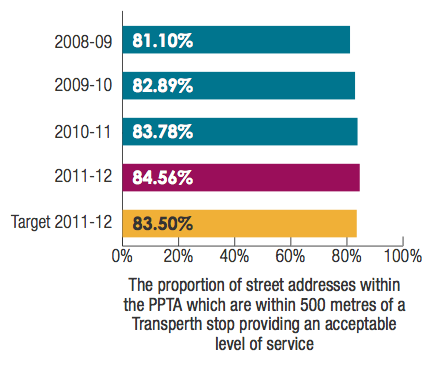
Accessibility to public transport increased by 0.94 per cent from 2010-11 and was 1.27 per cent above the target. While the number of PSAs within the PPTA increased by 3.38 per cent to 906,184 from 876,549 in 2010-11, the number of PSAs within 500 metres of an ASL stop increased by 4.35 per cent to 766,276 from 734,349 in 2010-11. The 2011-12 result indicates that a very high proportion of PSAs in Perth, 766,276 out of 906,184 (84.56 per cent) have ready access to an acceptable level of public transport services.
3. Service Reliability
According to an independent survey which measured customer satisfaction, service reliability is regarded as one of the most significant characteristics of a quality service. Service reliability is essentially a combination of two main factors, punctuality and consistency.
Services are considered to be punctual if they arrive within a defined period of time after the scheduled arrival time. This parameter is referred to as “On Time Running’ (OTR).
|
Operation |
‘OTR’ parameter |
|---|---|
Metropolitan and Regional Passenger Services |
|
|
Transperth Trains |
4 minutes |
|
Transperth Buses |
4 minutes |
|
Transperth Ferries |
3 minutes |
Country Passenger Rail and Road Coach Services |
|
|
Transwa Rail |
|
|
Prospector |
15 minutes |
|
Australind |
10 minutes |
|
AvonLink |
10 minutes |
|
MerredinLink |
10 minutes |
|
Road coaches |
10 minutes |
Regional school bus services |
|
|
Drop off no less than 10 minutes before school starts and pick up within 10 minutes of school ending |
|
The ‘OTR’ measure demonstrates the extent to which the PTA meets its service reliability standards.
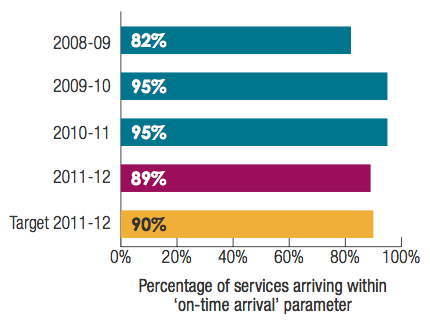
Transperth Train Services
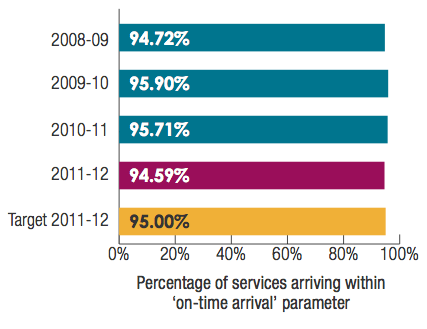
The ‘OTR’ of Transperth Trains in 2011-12 was marginally lower (0.43 per cent) than the target and marginally below (1.17 per cent) the previous year’s result.
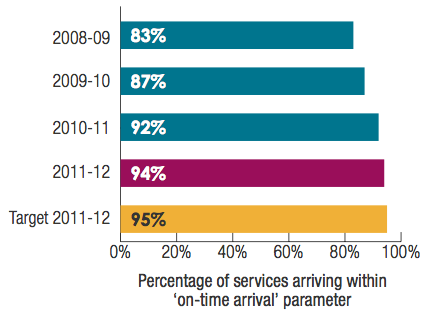
Transperth Bus Services
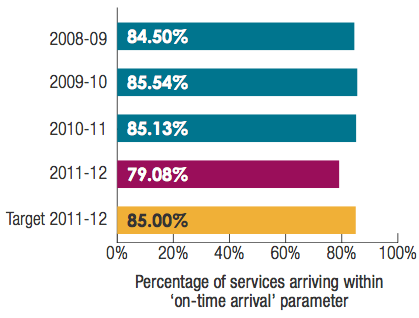
The ‘OTR’ of Transperth Bus in 2011-12 was 7.11 per cent less than 2010-11 and 6.97 per cent below the target due to congestion on the Perth Metropolitan road network especially the road works on the Great Eastern Highway widening, the Great Eastern Highway/Roe Highway overpass and the on-going works at various locations around the Perth CBD.
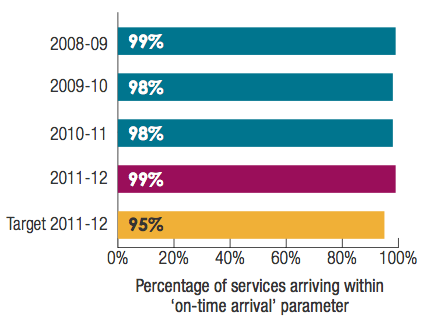
Transperth Ferry Services
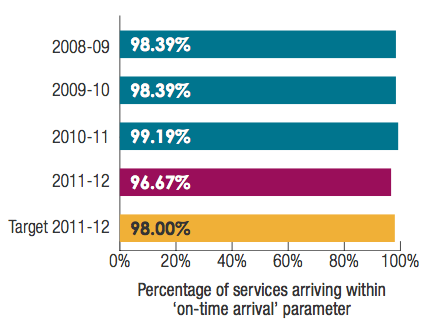
The 2011-12 target for the ferry ‘OTR’ key performance indicator was for services to arrive within three minutes of the scheduled time.
During the year, on average 96.67 per cent of services met the target compared with 99.19 per cent of services in 2010-11. Of the 120 trips checked during 2011-12 (1 per cent of total round-trips), four trips failed to meet the target.
The ‘OTR’ of Transperth Ferry in 2011-12 was 2.54 per cent less than 2010-11 and 1.36 per cent below the target.
Transwa Rail Services: Indicators of the ‘OTR’ performance for Transwa rail services are reported separately for each service.
a. Prospector
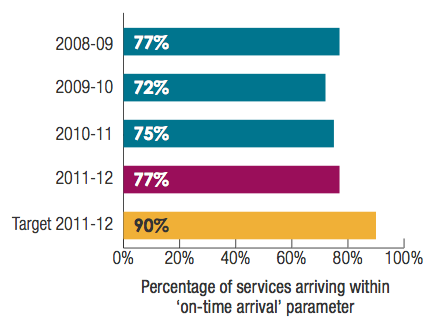
The ‘OTR’ of the Prospector in 2011-12 increased by 2.80 per cent from 2010-11 and was 14.34 per cent below the 2011-12 target. The disruptions in services were caused by delays with crossings, signal failures, track repairs and speed restrictions resulting from rail works.
b. Australind
The ‘OTR’ of the Australind in 2011-12 was 1.42 per cent below the target and 6.61 per cent below the previous year’s result. The decrease in the ‘OTR’ performance is associated with delays caused by crossings and mechanical issues.
c. AvonLink
The ‘OTR’ of AvonLink in 2011-12 increased by 0.82 per cent from 2010-11 and was 4 per cent above the target.
d. MerredinLink
The ‘OTR’ of MerredinLink in 2011-12 increased by 2.13 per cent from 2010-11 and was 1.10 per cent below the target. Delays caused by crossings were the primary reason for the failure to meet the ‘OTR’ performance target.
Transwa Road Coach Services
The ‘OTR’ of the Road Coach services in 2011-12 decreased by 1.09 per cent from 2010-11 but was 2.03 per cent above the target.
Regional School Bus Services
This indicator measures school bus timetable reliability for rural mainstream services and Special Education School buses operating in the metropolitan area. The ‘OTR’ parameter is to arrive at school no less than 10 minutes before school starts and depart within 10 minutes of school ending.
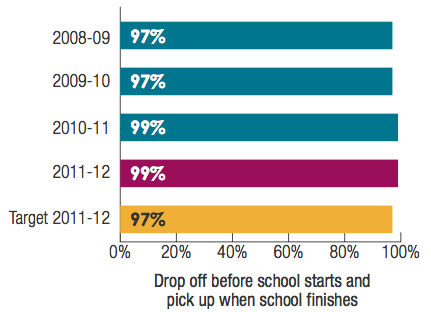
The ‘OTR’ in 2011-12 is the same as last year’s result and above the target by 1.82 per cent.
In 2011-12, 647 services were monitored for “on-time running’ of which 639 were within the time standard. The number of observations was within the acceptable limit of sampling error rate.
This indicator is calculated using a random sample which ties in with the School Bus Service inspection program.
The table shows five year performance to 30 June 2012:
|
Year |
Number of observations for compliance with “on-time arrival’ |
Observations that were compliant |
|---|---|---|
|
2007-08 |
1046 |
1022 |
|
2008-09 |
1030 |
1001 |
|
2009-10 |
888 |
864 |
|
2010-11 |
976 |
970 |
|
2011-12 |
647 |
639 |
The error rate of ± 3.05 per cent is within the ± 5 per cent tolerance level.
4. Level of Overall Customer Satisfaction
The proportion of patrons who expressed overall satisfaction with their public transport service level, measures the public perception of Transperth’s performance in providing a high-quality and attractive public transport service.
The measure for Transperth services is derived from an extensive annual survey conducted by independent pollsters. The survey, known as the “Passenger Satisfaction Monitor’ (PSM), provides an objective, unbiased view over time of patrons’ overall satisfaction with the system, EG safety, on-time running, courtesy of staff, service frequency and station amenities. The information is used by Transperth to develop strategies for improving service performance and infrastructure.
The pollsters interview a large sample of passengers in lengthy face-to-face surveys. Interviewers are assigned to various services and transit station locations over a four week period covering the working week and weekend.
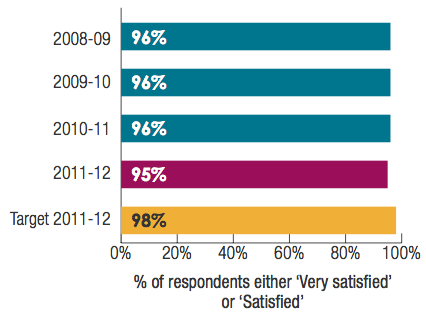
Transperth Train Services
For the train PSM, a total of 1018 train patrons were surveyed. The overall sample comprised of:
- Adults aged 18 years or over resident within the Perth metropolitan area
- Current users of Transperth train services (excluding school students)
- Patrons who travel on trains at least once per fortnight.
The sample error estimate was within ± 3 - 4 per cent and represents score differences required to reach the 95 per cent confidence level.
Overall satisfaction increased by 1.14 per cent from 2010-11 and was 3.26 per cent below the target.
The expressed levels of dissatisfaction decreased from 5 per cent in 2010-11 to 4 per cent in 2011-12.
The results have been driven by a 2.38 per cent increase in overall satisfaction of peak-time travellers (from 84 per cent in 2010-11 to 86 per cent in 2011-12).
The main reasons for dissatisfaction related to crowding issues, insufficient carriages and service frequency during peak times, service reliability and insufficient off-peak services (after 6pm or weekends).
Transperth Bus Services
For the Transperth bus PSM, a total of 3,067 bus patrons were surveyed. The overall sample comprised of:
- Adults aged 18 years or over resident within the Perth Bus Contract region
- Current users of Transperth bus services (excluding school students)
- Patrons who travel on bus at least once per fortnight.
The sample error estimate was within ± 2 - 3 per cent and represents score differences required to reach the 95 per cent confidence level.
Overall satisfaction increased by 1.22 per cent from 2010-11.
Levels of dissatisfaction remained unchanged at 10 per cent. The 2011-12 results are same as the last three years and consistent with those of the past decade.
Belmont, Joondalup and all CAT services recorded significantly higher satisfaction levels in 2011-12 ranging from 89 per cent to 95 per cent. Significantly higher dissatisfaction levels were recorded for Midland and Morley. Midland has recorded significant higher dissatisfaction and lower satisfaction compared to 2011.
The most frequently nominated reasons for dissatisfaction with the Bus system in 2011-12 were issues relating to service punctuality, frequency, limited connection of buses and trains and insufficient off-peak and weekend services.
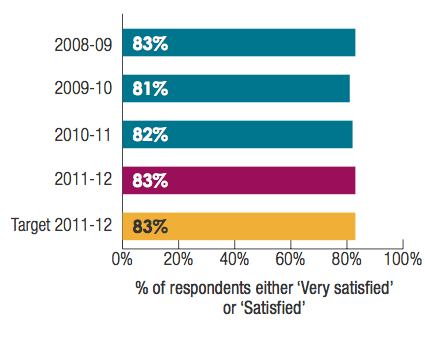
Transperth Ferry Services
For the Transperth ferry PSM, a total of 202 ferry patrons were surveyed. The overall sample comprised of:
- Adults aged 18 years or over resident within the Perth metropolitan area, (IE Patrons who were users of Transperth ferry services and used it more than once a fortnight for Perth residents)
- Patrons who were users of Transperth ferry services whilst visiting Perth
- School students were excluded from the sample.
The sample error estimate was within ± 10 per cent and represents score differences required to reach the 95 per cent confidence level.
Customer satisfaction with the overall level of Transperth ferry services remained very high at 95 per cent with a slight decrease from the previous three years. In 2011-12, zero per cent of the respondents indicated that they were dissatisfied at the overall service level, thus maintaining the long-term trend of satisfaction with Transperth ferry services. The proportions of users who were “very satisfied’ with the Transperth ferry services increased significantly compared to 2011.
The key factors affecting the level of satisfaction were the availability of seats, speed of the trip, cleanliness on board, punctuality, personal safety and cost of fares.
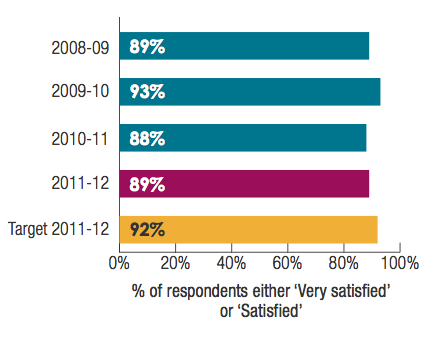
Transwa Train and Road Coach Services
An independent passenger satisfaction survey is undertaken annually for each service: Australind, Prospector, AvonLink, MerredinLink and road coaches.
In 2011-12, a total of 1,167 country services patrons were surveyed via a self-completion questionnaire.
The sample error estimate was within ± 3 - 5 per cent and represents score differences required to reach the 95 per cent confidence level.
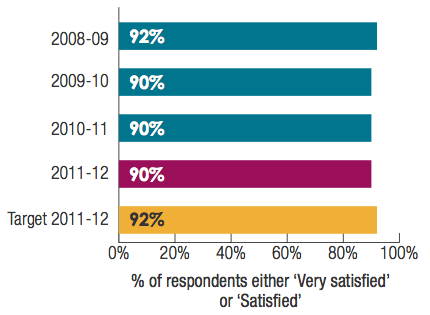
Overall satisfaction remained the same as the 2010-11 result and was 2.17 per cent below the target of 92 per cent in 2011-12.
A slight decrease in overall satisfaction was recorded for the Australind and the Prospector, however overall services recorded high level of satisfaction in 2011-12. The decrease in satisfaction of the Prospector service is attributed to the dissatisfaction with the entertainment system whilst there was minor dissatisfaction with the length of time for the trip on the Australind.
5. Customer Perception of Safety
Safety perceptions are an important factor in the public deciding whether to use public transport. The PTA is continuing to invest in security-related infrastructure and has increased its security staff to ensure that customers can see the tangible measures being taken to increase their safety.
Customer perceptions of safety are measured through data gathered in the Passenger Satisfaction Monitor (PSM) which distinguishes between on-train and on-bus and at stations, at night and during the day for the Transperth train and bus services.
Transperth Train Services
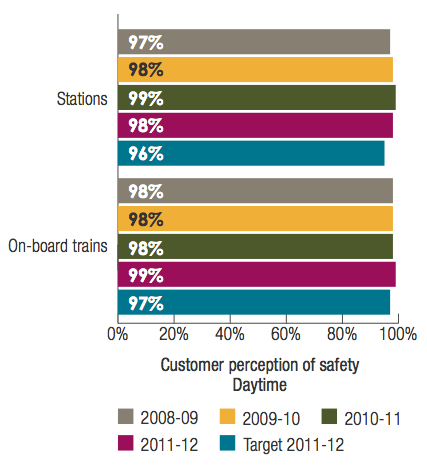
The indicator for perceived safety at train stations reached 98 per cent, below the 2010-11 result of 99 per cent and above the target of 96 per cent in 2011-12. This is a decrease of 1.01 per cent from 2010-11 and 2.08 per cent above the target.
The indicator for perceived safety on-board trains reached 99 per cent, above the target of 97 per cent in 2011-12. This is 2.06 per cent above the target.
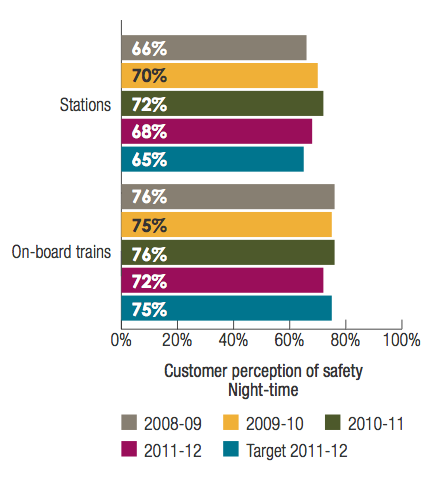
The indicator for perceived safety at train stations reached 68 per cent, below the 2010-11 result of 72 per cent and above the target of 65 per cent in 2011-12. This is a decrease of 5.56 per cent from 2010-11 and 4.62 per cent above the target.
The indicator for perceived safety on-board trains reached 72 per cent, below the 2010-11 result of 76 per cent and below the target of 75 per cent in 2011-12. This is a decrease of 5.26 per cent from 2010-11 and 4.00 per cent below the target.
Transperth Bus Services
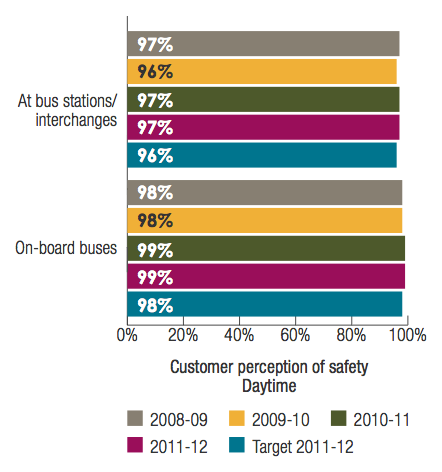
The indicator for perceived safety at bus stations reached 97 per cent, same as the 2010-11 result and was 1.04 per cent above the target.
The indicator for perceived safety on board reached 99 per cent, same as the 2010-11 result of 99 per cent and was 1.02 per cent above the target.
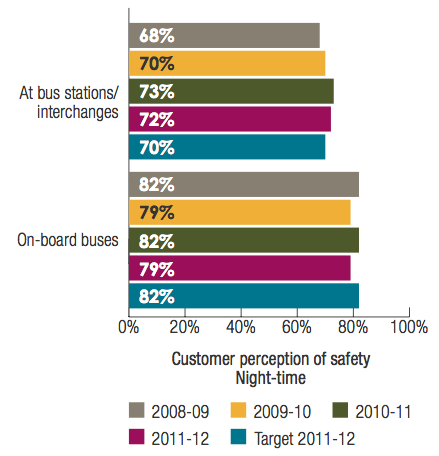
The indicator for perceived safety at bus stations reached 72 per cent, 1.37 per cent below the 2010-11 result and 2.86 per cent above the target.
The indicator for perceived safety on-board buses reached 79 per cent, 3.66 per cent below the 2010-11 result and the target.
6. Level of Notifiable Occurrences
Rail Safety
Railway safety incidents are recorded and notified to the Office of Rail Safety. These incidents are termed “notifiable occurrences’ and are defined in the Rail Safety Regulations 2011 as Category “A’ (serious injury, death, or significant damage) or Category “B’ (incidents that may have the potential to cause a serious accident). Notifiable occurrences reporting is a legislated requirement under the Rail Safety Act 2010 for the accredited owner and operator of a rail system and form part of the PTA’s safety management system. These arrangements do not cover bus operations.
The performance measure for Category “A’ and “B’ occurrences is expressed as the number of occurrences per million passenger boardings and per million train kilometres. A low rate of incidents indicates that sound safety procedures and risk management procedures/controls exist and are operating effectively throughout the rail system.
The benchmark values for Category “A’ and Category “B’ incidents are calculated on the projected estimations of the number of future passenger boardings and train kilometres.
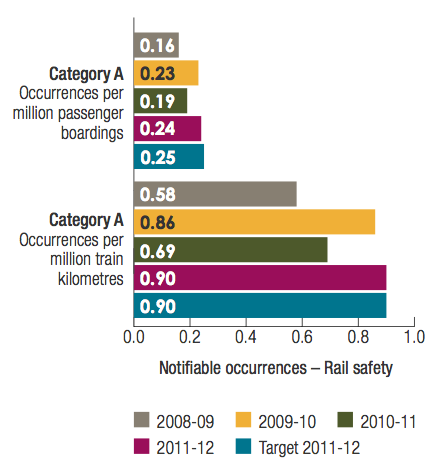
The indicator for Category “A’ incidents per million passenger boardings reached 0.24, 27.38 per cent above the 2010-11 result and 5.16 per cent below the target of 0.25 in 2011-12. The KPIs were calculated based on 15 Category “A’ incidents, total train kilometres of 16.598 million and 63.268 million boardings in 2011-12.
The indicator for Category “A’ occurrences per million train kilometres reached 0.90, 30.46 per cent above the 2010-11 result and was on target.
Category “A’ occurrences, which includes suicides, increased by 36.36 per cent from 11 in 2010-11 to 15 in 2011-12.
However, when excluding suicides and attempted suicides, there were 9 Category “A’ occurrences compared to 3 in 2010-11.
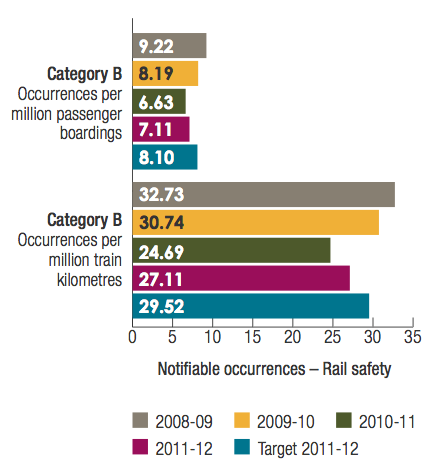
The indicator for Category “B’ incidents per million passenger boardings reached 7.11, above the 2010-11 result of 6.63 and below the target of 8.10 in 2011-12. This is an increase of 7.24 per cent from 2010-11 and 12.19 per cent below the target. There were 450 Category “B’ occurrences in 2011-12 compared to 392 in 2010-11.
The indicator for Category “B’ occurrences per million train kilometres reached 27.11, 9.83 per cent above the 2010-11 result and 8.16 per cent below the target in 2011-12.
Effective Safety Management Systems controls are in place and ongoing reviews undertaken to minimise the incidents.
Regional School Bus Services Safety
Accidents attributable to all causes are notified to the PTA. The measure for the notifiable occurrences is expressed as the number of accidents (major and minor) reported during the school year.
A low number of occurrences indicate that effective safety management procedures and controls exist and are being adhered to by school bus contractors and drivers throughout the regional school bus fleet.
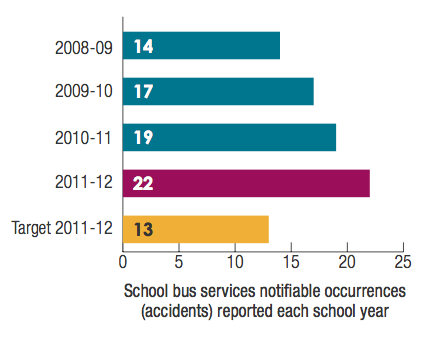
The indicator reached 22, above the 2010-11 result of 19 and above the target of 13 in 2011-12. This is an increase of 15.79 per cent from 2010-11 and 69.23 per cent above the target.
All 22 “on-road’ school bus accidents in 2011-12 were minor accidents and 59 per cent occurred through no fault of the school bus driver compared with 68.42 per cent in 2010-11.
Of the 22 accidents, 12 occurred in the country area and 10 in metropolitan Perth. School Bus Services continues to campaign and educate school bus contractors and drivers about the relative risks associated with accidents and measures such as the requirement for all contractors to have in place Safety Management plans are effective means of improving and maintaining safety standards.
Efficiency Indicators
The PTA’s effectiveness in providing a cost efficient public transport system is measured using the following key efficiency indicators:
1. Average cost per passenger kilometre
2. Average cost per 1,000 place kilometres
3. Average cost per contracted kilometres
1. Average Cost per Passenger Kilometre
This indicator measures the cost efficiency of providing passenger services, expressed as the cost of carrying one passenger one kilometre.
Transperth
Passenger kilometres are calculated by multiplying the number of total boardings by the average trip length.
The indicator measures the cost efficiency of the services, IE the trend in the cost of carrying one passenger over one kilometre. A declining trend indicates that the resources used to provide the services are being utilised in a cost efficient manner.
Transperth Train Services
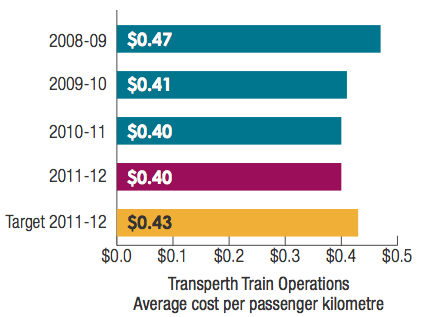
The indicator maintained the 2010-11 result of $0.40 and was 6.78 per cent below the target.
Cost of the services increased to $392.857 million from $379.175 million in 2010-11 by 3.61 per cent and was 7.44 per cent below the budget target of $424.431 million. This was mainly due to the reduction in interest cost and railcar maintenance cost.
Passenger kilometres increased to 980.073 million in 2011-12 by 3.57 per cent from 946.283 million in 2010-11 and was below the target of 986.815 million by 0.68 per cent.
Transperth Bus Services
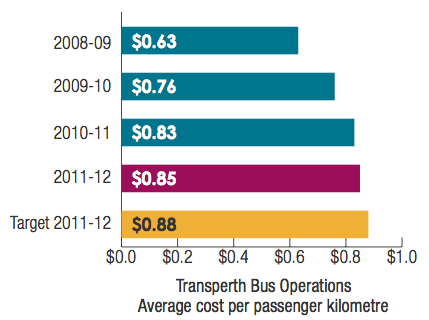
The indicator reached $0.85, 2.49 per cent above the 2010-11 result of $0.83 and 2.95 per cent below the target of $0.88 in 2011-12.
Cost of the services increased by 9.57 per cent to $385.533 million from $351.869 million in 2010-11 and was 2.33 per cent above the budget target of $376.741 million. This was mainly due to the increased bus kilometres and passengers resulting in increased bus maintenance and operating costs.
Passenger kilometres increased by 6.90 per cent to 451.404 million from 422.251 million in 2010-11 and was 4.95 per cent above the target of 430.112 million.
Transperth Ferry Services
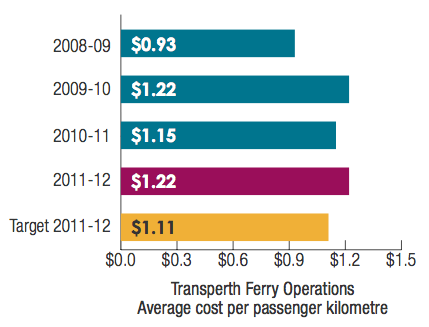
The indicator reached $1.22, 6.14 per cent above the 2010-11 result of $1.15 and 9.69 per cent above the target of $1.11 in 2011-12.
Cost of the services increased by 6.68 per cent to $0.796 million from $0.746 million in 2010-11 and was 8.45 per cent above the budget target of $0.734 million. The increase in costs is due to the refurbishment of the MV Shelley Taylor-Smith ferry.
Passenger kilometres increased by 0.51 per cent to 653,744 from 650,446 in 2010-11 and was 1.10 per cent below the target of 661,000.
Transwa Rail Services
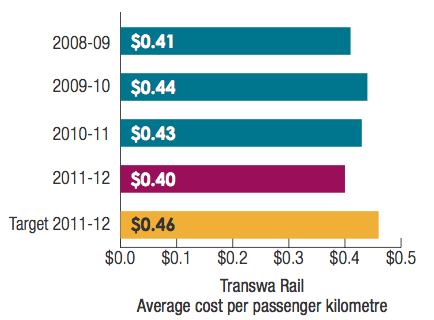
The indicator reached $0.40, 5.29 per cent below the 2010-11 result of $0.43 and 12.16 per cent below the target of $0.46 in 2011-12. This reduced cost is due to a 6.29 per cent increase in passenger kilometres from 72.215 million in 2010-11 to 76.756 million in 2011-12 (driven mainly by the 10.18 per cent increase in Prospector patronage) and a marginal 0.66 per cent increase in operating expenses.
Transwa Road Coach Services
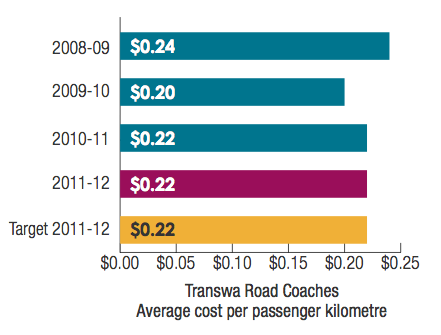
The indicator was on target and consistent with the previous year.
2. Average Cost per 1000 Place Kilometres
This indicator measures the cost efficiency of providing the service per 1000 place kilometres and it is calculated for each mode by dividing total cost by place kilometres and multiplying by 1,000. Place kilometres are calculated by multiplying the average fleet capacity by the service kilometres.
Regional Bus Services: Intra-Town and Inter-Town Services
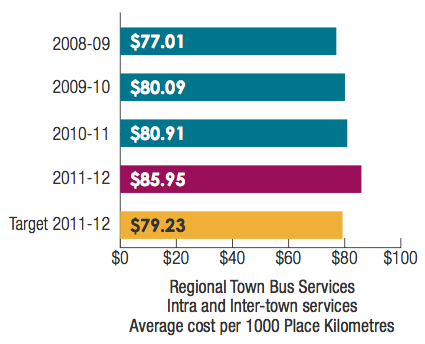
The indicator reached $85.95, 6.24 per cent above the 2010-11 result of $80.91 and 8.49 per cent above the target of $79.23 in 2011-12.
The increase was due to the “one-off” additional expenditure related to the outsourcing of the TransGoldfields Bus service IE significant bus fleet repairs and maintenance costs in Bunbury and the recognition of the increased costs of operating a subsidised 4WD inter-town bus service in the Pilbara region.
When compared to 2010-11, total passenger place kilometres for intra-town and inter-town services recorded a 3.89 per cent increase from 190.874 million to 198.298 million in 2011-12 and total costs increased by 10.37 per cent from $15.443 million to $17.045 million in 2011-12. Service kilometres also increased by 4.28 per cent from 2.843 million kilometres in 2010-11 to 2.965 million in 2011-12.
Total Passenger Place Kilometres (millions)
This indicator measures the total number of passengers that can be carried for the service kilometres.
It is calculated for each mode of transport by multiplying the average fleet capacity by the service kilometres and this represents the capacity provided on each mode.
The service kilometres for most intra-town services are calculated using the Transperth Route Information System (TRIS).
Regional Bus Services: Intra-Town and Inter-Town Services
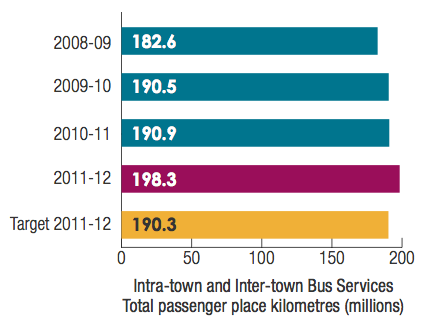
The indicator reached 198.3, above the 2010-11 result of 190.9 and above the target of 190.3 in 2011-12. This is an increase of 3.89 per cent from 2010-11 and 4.20 per cent above the target.
Service kilometres increased by 4.28 per cent from 2.843 million kilometres in 2010-11 to 2.965 million in 2011-12 mainly due to the inclusion of a new Dunsborough public school bus service in the intra-town service and general increases in service kilometres of the seven inter-town services.
3. Average Cost per Contracted Kilometres
Regional School Bus Services
The cost of administering school bus services on a kilometre basis is calculated by dividing the total cost of school bus contracts and operating expenses by the total contracted kilometres.
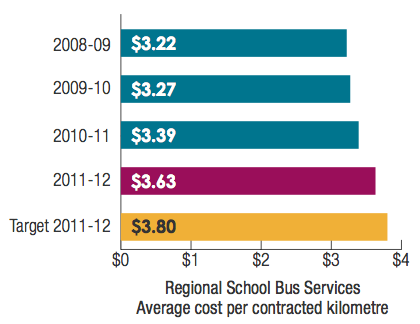
The indicator reached $3.63, above the 2010-11 result of $3.39 and below the target of $3.80 in 2011-12. This is an increase of 7.09 per cent from 2010-11 and 4.35 per cent below the target.
During the year, total costs increased by 6.26 per cent to $107.652 million from $101.310 million in 2010-11. This includes the costs associated with the phased introduction of air conditioning and automatic transmission on contract school buses and the expansion of the cluster contract arrangements.
Contract kilometres decreased by 0.78 per cent to 29.617 million kilometres from 29.849 million in 2010-11.
Outcome 2: Protection of the long-term functionality of the rail corridor and railway infrastructure
Effectiveness Indicator
The most significant issue for this outcome is the management of the long-term lease of the rail freight infrastructure to Brookfield Rail Pty Ltd.
Brookfield Rail manages and operates the rail freight infrastructure under the terms of the Railway Infrastructure Lease. Under the Lease, Brookfield Rail is the “accredited owner’ of the infrastructure as defined in the Rail Safety Act 1998.
Under the terms and conditions of the Railway Infrastructure Lease, an independent inspection of the railway infrastructure is carried out every five years. The last independent inspection was completed in June 2010.
The results of this inspection did not indicate any cause for concern and confirmed that the rail corridor and infrastructure was being satisfactorily maintained.
Cost Efficiency
The cost efficiency for the management of the long-term lease of the rail freight infrastructure to Brookfield Rail is monitored using the total cost of managing the rail corridor and residual freight issues.
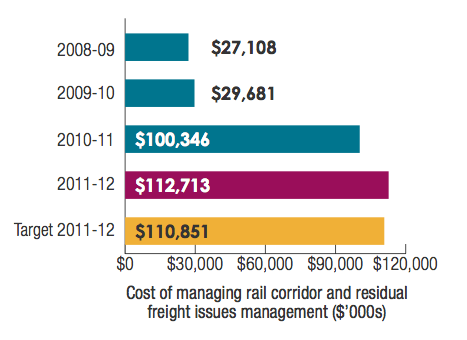
The cost of managing the rail corridor and residual freight issues in 2011-12 was above the target by 1.68 per cent mainly due to a “one-off” subsidy paid to Brookfield Rail to keep some Tier 3 lines open whilst adjacent roads were upgraded and the increased depreciation resulting from grain re-sleepering program.
The significant increase in 2010-11 was the result of a revaluation of the freight network which increased the depreciation costs by $76 million.