Service and Financial Achievements
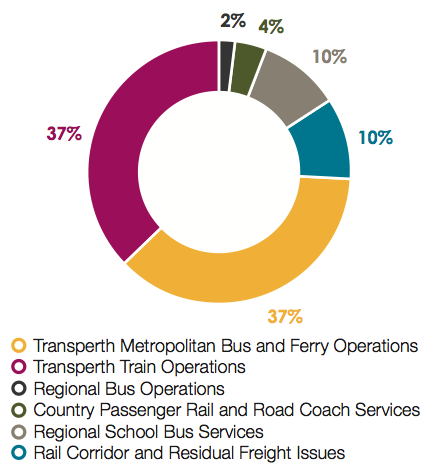
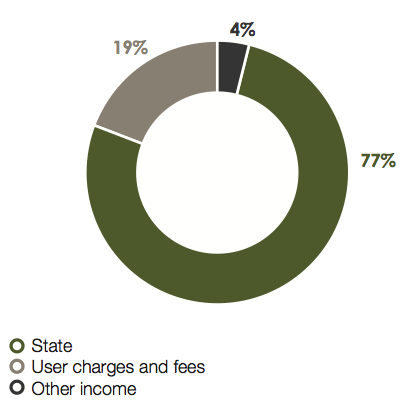
During the financial year 2011-12, the PTA has delivered public transport services to the people of Western Australia worth $1,076.7 million. The graph below shows how these funds were spent across each service. Refer to the individual sections of Review of Performance by mode for further details on expenditure by services. Total revenue and funding received during the year amounted to $1,014.3 million.
Expenditure by Service
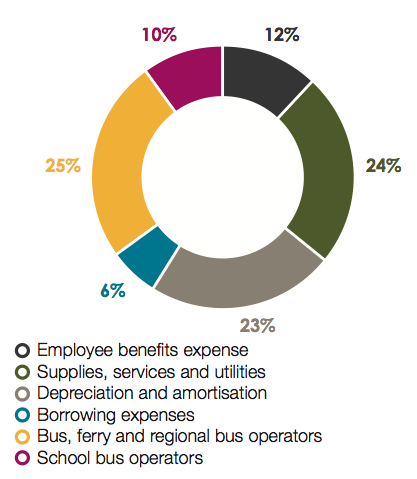
Total Expenditure by Type
Revenue and Funding Sources
Financial Targets: Actuals compared to budget targets
The following table provides a comparison of the financial targets and outcomes against criteria included in the Resource Agreement between the Chief Executive Officer, Minister for Transport and the Treasurer.
| 2011-12 Target $000 |
2011-12 Actual $000 |
Variation $000 |
||
|---|---|---|---|---|
|
Total cost of services |
1,097,519 |
1,076,687 |
20,832 |
Note 1 |
|
Net cost of services |
897,577 |
843,463 |
54,114 |
Note 2 |
|
Total Equity |
4,649,690 |
4,748,089 |
( 98,399) |
Note 3 |
|
Net increase/(decrease) in cash held |
(4,199) |
(13,130) |
(8,931) |
Note 4 |
|
Number of FTE’s |
Number of FTE’s |
Number of FTE’s |
||
|
Approved full time equivalent |
1,474 |
1,459 |
15 |
Note 5 |
Notes:
(1) Total Cost of Services
The decrease is mainly due to a reduction in borrowing costs following an interest rate review ($16.6 million).
(2) Net Cost of Services
The variation is primarily due to a reduction in expenses (see Note 1) and an increase in revenue.
(3) Total Equity
The variation is mainly due to an increase in non-current assets.
(4) Net Decrease in Cash Held
The net decrease is mainly due to the advancement of expenditure on capital projects offset by increased provisions for contaminated sites and workers compensation.
(5) Approved Full Time Equivalent
The variation to the approved FTE staff level is mainly due to lower than anticipated recruitment of transit officers. Train security was maintained by use of CCTV and contracted security services.
Summary of Key Performance Indicators: Actual compared to budget targets
|
2011-12 Target |
2011-12 Actual |
Variation |
|
|---|---|---|---|
|
Outcome: Accessible, Reliable and Safe Public Transport System. |
|||
|
Key Effectiveness Indicators |
|||
|
Use of public transport - passengers per service kilometre: |
|||
|
1.38 |
1.39 |
0.01 |
|
4.09 |
4.21 |
0.12 |
|
13.88 |
13.68 |
(0.20) |
|
0.852 |
0.818 |
(0.034) |
|
0.23 |
0.239 |
0.009 |
|
0.07 |
0.066 |
(0.004) |
|
Accessible Public Transport: |
|||
|
The proportion of street addresses within the Perth Public Transport Area which are within 500 metres of a Transperth stop providing an acceptable level of service |
83.50% |
84.56% |
1.06% |
|
Metropolitan and regional passenger services reliability: |
|||
|
85.0% |
79.08% |
(5.92%) |
|
95.0% |
94.59% |
(0.41%) |
|
98.0% |
96.67% |
(1.33%) |
|
Country passenger rail and road coach services reliability: |
|||
|
90% |
77% |
(13%) |
|
90% |
89% |
(1%) |
|
95% |
94% |
(1%) |
|
95% |
99% |
4% |
|
95% |
97% |
2% |
|
Regional school bus services reliability: |
|||
|
97% |
99% |
2% |
|
Level of overall customer satisfaction - customer satisfaction index: |
|||
|
83% |
83% |
0% |
|
92% |
89% |
(3%) |
|
98% |
95% |
(3%) |
|
92% |
90% |
(2%) |
|
Customer perception of safety - independent external surveys: |
|||
|
96% |
98% |
2% |
|
97% |
99% |
2% |
|
65% |
68% |
3% |
|
75% |
72% |
(3%) |
|
96% |
97% |
1% |
|
98% |
99% |
1% |
|
70% |
72% |
2% |
|
82% |
79% |
(3%) |
|
Level of notifiable safety occurrences - notifiable occurrences: |
|||
|
0.25 |
0.24 |
(0.01) |
|
0.90 |
0.90 |
0.00 |
|
8.10 |
7.11 |
(0.99) |
|
29.52 |
27.11 |
(2.41) |
|
13 |
22 |
9 |
|
Outcome: Protection of the long-term functionality of the rail corridor and railway infrastructure: |
|||
|
Nil |
Nil |
Nil |
|
Key Efficiency Indicators |
|||
|
Service 1: Metropolitan and Regional Passenger Services |
|||
|
Average cost per passenger kilometre |
|||
|
$0.88 |
$0.85 |
($0.03) |
|
$0.43 |
$0.40 |
($0.03) |
|
$1.11 |
$1.22 |
$0.11 |
|
Average cost per 1,000 place kilometres |
|||
|
$79.23 |
$85.95 |
$6.72 |
|
Total passenger place kilometres (millions) |
|||
|
190.30 |
198.30 |
8.00 |
|
Service 2: Country Passenger Rail and Road Coach Services |
|||
|
Average cost per passenger kilometre |
|||
|
$0.46 |
$0.40 |
($0.06) |
|
$0.22 |
$0.22 |
$0.00 |
|
Service 3: Regional School Bus Services |
|||
|
Average cost per contracted kilometre: School bus services |
$3.80 |
$3.63 |
($0.17) |
|
Service 4: Rail Corridor and Residual Freight Issues |
|||
|
Total cost of managing the rail freight corridor and residual freight issues |
$110,851,000 |
$112,713,000 |
$1,862,000 |
Note: For more explanations on the variation, please refer to the section Audited Key Performance Indicators.
a) The Prospector on time running result was below target as a result of disruptions in services due to track repairs, speed restrictions, signal failures and train crossing delays due to increased traffic.
b) Category “B’ incidents per million passenger boardings and per million train kilometres were 12.19 per cent and 8.16 per cent lower than target.
c) Regional school bus services notifiable occurrences were 69 per cent above target; 59 per cent of the accident cases occurred through no fault of the school bus driver. No major incidents occurred and no fatalities or serious injuries were recorded.
d) The Transwa rail cost per passenger kilometre in 2011-12 was 12.16 per cent below target mainly due to a deferment in maintenance cost.