transperth buses
Description of services
Transperth’s bus services are divided into 11 geographic contract areas, which are periodically subject to competitive tender. Currently three contractors operate the 11 contract areas:
- Path Transit (Marmion-Wanneroo and Morley contracts, with the Joondalup CAT contract forming part of the Morley contract).
- Swan Transit (Canning, Kalamunda, Midland, Southern River, Claremont, and Belmont contracts).
- Southern Coast Transit (Rockingham, Fremantle-Cockburn, and Perth CAT contracts, with the Fremantle CAT contract part of the Fremantle-Cockburn contract).
In 2007/08, the Transperth bus system operated 318 standard timetabled bus routes and 418 school routes. On a typical weekday this involved operating 10,693 standard services and 418 school services. Accessible buses are always used on 90 of the standard routes. A bus service frequency of 20 minutes or better is provided all day on most major corridors, with higher frequencies in peak periods.
The year’s developments
To coincide with the opening of the Mandurah Line, Transperth introduced a comprehensive bus feeder network across Perth’s southern suburbs. The network consists of 62 new services, including some into previously un-serviced communities in the southern corridor. In addition, increased frequency was provided along key corridors and a new connection was established between Canning Bridge Station and the Curtin University precinct. Transperth also completed extensive plans for improvements to Joondalup Line feeder bus services in the shoulder of the evening peak, with these improvements winning support in the 2008/09 budget.
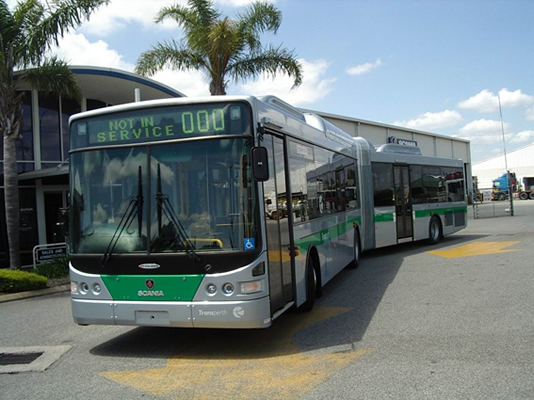
During the year, Transperth began an evaluation trial of new low-floor CNG articulated buses, View image which are expected to replace its ageing diesel-powered articulated fleet. Two buses were introduced in 2007/08 with a third expected to start early in 2008/09.
Total service kilometres operated by the Transperth bus network continued to increase. In 2007/08, the network covered 50.923 million kilometres, up 1.9 per cent on 2006/07’s 49.961 million kilometres (itself a 1.7 per cent increase on the previous year). In the five-year period to 2007/08, bus service kilometres increased by 6.3 per cent. Total capacity provided by the bus network increased for the second year with 3637.6 million passenger place kilometres being provided in 2007/08, compared with 3592.5 million in 2006/07, an increase of 1.3 per cent, following an increase of 0.9 per cent the previous year. The lower rate of increase in passenger place kilometres compared with service kilometres is due to the increasing proportion of CNG buses in the fleet, which have a marginally lower average carrying capacity than diesel buses.
At 30 June 2008, Transperth operated 365 CNG buses in its fleet of 1124 buses. A further 233 CNG buses are due to be delivered by June 2011 under the existing bus supply agreement.
A CNG refuelling facility was commissioned at Rockingham in June 2007, and CNG refuelling operations commenced at the new Welshpool Bus Depot in June 2008. The installation of a high-pressure pipeline for the Karrinyup Bus Depot CNG facility started toward the end of the financial year and is scheduled to be commissioned in June 2009.
The safety audits of Transperth's bus contractors continued in line with standard AS 4801-OSH Management Systems. These regular audits have brought about improved safety management systems. The Lost Time Injury rate for Transperth's contractors continues to be well below the industry standard of 3.9. The safety standards of Transperth’s bus contractors continue to be high as reflected below:
- Swan Transit was re-certified to AS 4801.
- Path Transit was re-certified to AS 4801 and has recently achieved the WorkSafe Platinum Award.
- Southern Coast Transit was re-certified to AS 4801 and has achieved the WorkSafe Platinum Award.
A program began to upgrade Transperth workshop facilities with a view to ensuring that maintenance of CNG-fuelled buses is carried out in a safe environment. In addition to the installation of gas detection sensors at workshops, contractors have been provided with guidance on the requirements for safe-working procedures when carrying out maintenance on CNG buses.
Cost of the service
The total cost of operating Transperth bus services increased 7.2 per cent from $254.042 million in 2006/07 to $272.315 million in 2007/08. Operating costs increased 10.1 per cent from $205.298 million to $225.931 million. Total cost in 2006/07 included a CUC of $7.182 million. Excluding this charge, 2006/07 total cost was $246.860 million; hence the 2007/08 total of $272.315 million represents an increase of 10.3 per cent.
The increase in bus operating costs was due mainly to the 17 per cent increase in fuel costs and a 4.3 per cent increase in wage costs. There were also cost increases associated with the introduction of the extensive bus feeder network in the southern suburbs.
Patronage
Patronage on Transperth’s bus services continued to increase. In 2007/08, total boardings rose 1.7 per cent from 64.623 million in 2006/07 to 65.694 million, and fare-paying boardings rose 1.2 per cent from 38.886 million to 39.361 million.
At 1.2 per cent, the rate of increase in farepaying boardings is twice that of 2006/07 (0.6 per cent). This increase was driven by increases in Marmion-Wanneroo (2.5 per cent), Morley (two per cent), Southern River (7.7 per cent), Belmont (5.3 per cent) and Claremont (6.9 per cent). Fare-paying boardings in Fremantle-Cockburn fell by 0.5 per cent (following a 3.2 per cent reduction in 2006/07), Rockingham-Mandurah dropped 6.4 per cent (down 1.2 per cent in 2006/07) and Canning fell by 5.3 per cent (up 2.4 per cent in 2006/07). The popular Circle Route (a high frequency bus service connecting major shopping centres, universities, schools and colleges) recorded a small (0.4 per cent) increase.
Despite the recovery in the bus patronage growth rate, road congestion, particularly during peak periods, and the lack of adequate bus priority measures on major roads, will continue to impact on service reliability and affect patronage.
Fare-paying boardings per service kilometre continued to decline, falling 0.7 per cent from 0.778 in 2006/07 to 0.773. This was due to service kilometres increasing at a higher rate than fare-paying boardings – 1.9 per cent compared with 1.2 per cent. The rate of decline in total boardings per service kilometre was less, 0.3 per cent, from 1.293 in 2006/07 to 1.290, due to total boardings increasing at a slightly slower 1.7 per cent than service kilometres (1.9 per cent).
Passenger satisfaction
The 2008 PSM showed that the proportion of bus users who were satisfied with the bus system overall fell to 78 per cent from 81 per cent in 2007.
The importance rating of the service characteristics of Transperth’s bus services (other than passenger safety) and the level of satisfaction for each key service characteristic are shown in the table below. In 2008, “driver’s handling of the bus” and “number of buses during peak times” were replaced with “shelter provided at bus stops” and “availability of seats”. The survey shows there was a significant level of dissatisfaction with the number of buses on weekdays (20 per cent compared to 17 per cent in 2007), punctuality of the bus (12 per cent), and shelter provided at the bus stop (20 per cent). In addition, as shown in the next section, dissatisfaction was high in respect of “personal safety at station/interchange at night” and “personal safety on board at night”.
| Service characteristic | Importance rating | Satisfaction rating | ||
|---|---|---|---|---|
| 2007 | 2008 | 2007 | 2008 | |
|
Punctuality of the bus |
64% |
71% |
76% (12%) |
77% (12%) |
|
Number of buses on weekdays |
63% |
64% |
72% (17%) |
69% (20%) |
|
Cost of fares |
65% |
61% |
70% (9%) |
70% (8%) |
|
Cleanliness on board |
59% |
53% |
89% (3%) |
90% (3%) |
|
Speed of the trip |
62% |
52% |
84% (7%) |
87% (5%) |
|
Shelter provided at the bus stop |
– |
49% |
– |
72% (20%) |
|
Availability of seats |
– |
45% |
– |
91% (5%) |
|
Driver’s manner |
55% |
40% |
90% (2%) |
91% (2%) |
Note: Dissatisfaction level shown in parenthesis.
Passenger safety
In the PSM, bus users were asked: “How safe do you generally feel from personal interference or threat from other passengers?”
The above graph shows the proportion of respondents who “always feel safe” or “usually feel safe” at the specified times/locations on the bus network.
The results for the past five years show that almost all bus passengers generally felt safe on board buses and at station/interchanges during the day. However, the proportion of respondents who generally felt safe on buses at night – which had increased to 83 per cent in 2007 from 78 per cent in 2006 – fell back to 78 per cent in 2008. Similarly, the proportion of respondents who generally felt safe at night at the station/interchange – which also increased from 2006’s 66 per cent to 68 per cent in 2007 – fell to 63 per cent in 2008. The security concerns expressed by passengers who use Transperth’s bus services at night are being given focussed attention. While noting that most passenger security concerns are based on perception rather than actual events, Transperth will focus even further attention on improving bus system security. Improvements in recent years include:
- Two security officers are deployed from Monday to Saturday at major bus stations during core hours.
- Mobile patrols are deployed on each of the three major sectors – north, south and east – on busy nights of the week.
- There is centrally-monitored CCTV at all bus stations.
- CCTV on all new buses in the fleet.
Major initiatives for 2008/09
- Complete the feasibility study of rapid transit plans for Perth’s north-eastern corridor.
- Introduce the new route 79 linking Wellington Street Bus Station and Queen Elizabeth II Medical Centre (QEII) via the Esplanade Busport and University of Western Australia (UWA) to cater for growing demand associated with expansion of the QEII/UWA precinct.
- Introduce a jointly-funded bus service linking Glendalough Station and the Herdsman Business Park.
- Commence a trial of an additional Joondalup CAT Service to serve the Arena Sports Complex and Winton Road business park.
- In conjunction with local government, complete a transport needs analysis for the Byford area.