transperth ferries
Description of services
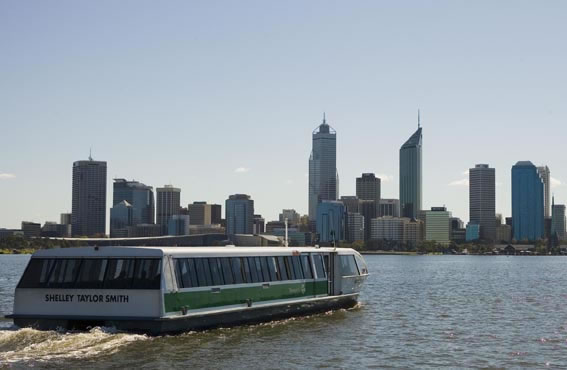
Two Transperth ferries View image operate between the City (Barrack Street) and South Perth (Mends Street) providing 80 services on an average weekday, September to April, and 60 services on an average weekday, May to August.
The Transperth ferry service has been competitively tendered since 1995, and the service is provided under contract by Captain Cook Cruises.
Patronage
The ferry service represents only a very small part of the Transperth system’s patronage. The upward trend in ferry patronage recorded in 2005/06 and 2006/07 was reversed in 2007/08 with significant reductions recorded in both fare-paying and total boardings. Fare-paying boardings fell by five per cent from 435,000 in 2006/07 to 413,000, while there was a 15 per cent decrease in total boardings (from 545,357 to 463,673). This significant fall in total boardings was due to the change in the methodology for determining transfers resulting in a 55.6 per cent decline in transfers to the ferry. Previously, cash transfers to the ferry were manually recorded by drivers using the on-board ticket issuing machines, while MultiRider transfers were recorded on ticket validating machines on the jetties. From July 2007, the ratio of SmartRider transfers to SmartRider initial tag-ons on the ferry service was used as a very accurate modelling tool and applied to cash fare-paying boardings to determine cash transfers. This is considered to provide a more accurate estimate of cash transfers as SmartRider transfers are accurately recorded through its tag-on/tag-off facility.
On a per kilometre basis, ferry fare-paying boardings fell by 5.4 per cent from 12.598 to 11.921 in 2007/08. Total boardings per service kilometre fell 15.3 per cent from 15.799 to 13.385.
Passenger satisfaction
The 2008 PSM showed that a very high proportion of passengers continued to express satisfaction with Transperth’s ferry service overall, continuing the trend over the past five years.
| Service characteristic | Importance rating | Satisfaction rating | ||
|---|---|---|---|---|
| 2007 | 2008 | 2007 | 2008 | |
|
Cleanliness on board |
80% |
80% |
97% (0%) |
96% (0%) |
|
Cost of fares |
70% |
67% |
92% (2%) |
86% (1%) |
|
Availability of seats on the ferry |
54% |
63% |
100% (0%) |
98% (0%) |
|
Punctuality of the ferry service |
66% |
61% |
92% (1%) |
92% (1%) |
|
Number of ferries during off-peak |
62% |
60% |
77% (9%) |
78% (6%) |
|
Speed of trip |
50% |
57% |
96% (1%) |
97% (1%) |
|
Shelter at the jetty |
55% |
55% |
80% (14%) |
75% (11%) |
|
Availability of timetables |
– |
49% |
– |
74% (3%) |
Note: Dissatisfaction level shown in parenthesis.
The importance rating of the service characteristics of Transperth’s ferry services (other than passenger safety) and the level of satisfaction for each key service characteristic are shown in the table above. In 2008, “availability of timetables” replaced “access ticket purchase facilities.”
Passenger safety
In the PSM, ferry users were asked: “How safe do you generally feel from personal interference or threat from other passengers?” The graph shows the proportion of respondents who “always feel safe” or “usually feel safe” at the specified times. The results for the past five years show that almost all ferry passengers generally felt safe on the ferry during the day and at night and at the jetty during the day. The proportion of users who felt safe at the jetty at night, which had declined to 89 per cent in 2007, increased to 91 per cent in 2008.