Transperth is the brand and operating name of the public transport system in the greater metropolitan area of Perth.
The Transperth system consists of a bus network, a fully-electrified urban train system and a ferry service. The system is managed by the Transperth branch of the Transperth System, Regional and School Bus Services division, which provides overall management of the Transperth system, including functions such as system planning, marketing and ticketing. The division also contract-manages key functions including bus service delivery.
Transperth bus and ferry services are provided under commercial contract arrangements, while Transperth train services are provided by the PTA’s Transperth Train Operations (TTO) division.
Passenger information is provided through information offices and a call centre. The Perth Station information office is operated by TTO, while all other Transperth information offices are operated by Transperth contractor Serco.
objectives and outcomes
The objectives and outcomes for Transperth for 2007/08 were:
| OBJECTIVE | OUTCOME |
|---|---|
|
Commence operations on the new Mandurah Line. |
Operations commenced on 24 December 2007 supported by: An extensive feeder bus network, with all southern corridor bus services re-orientated to link the new bus/train interchanges with surrounding suburbs and key facilities. An expanded customer service branch within TTO, including a large team of Passenger Ticketing Assistants integral to the operation of fare-gated major train stations. |
|
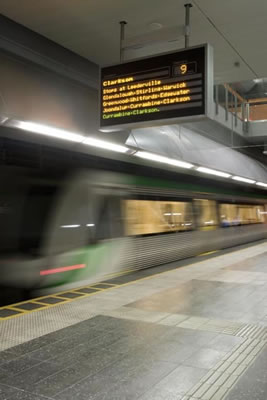
Complete installation of the Customer Information System (CIS), View image a component of the PTA’s new train control system designed to provide passengers with accurate, up-to-date and timely information on train services. |
Installation commenced in May 2007 and is scheduled to be completed by August 2008. |
|
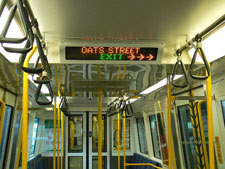
Continue installation of the Recording and Passenger Information Dissemination System (RAPID) View image to A-series railcars. |
RAPID was installed on 15 A-series railcars during the year, bringing the number completed to 34 out of the 48 A-series railcars. The program is expected to be completed in 2009/10. |
|
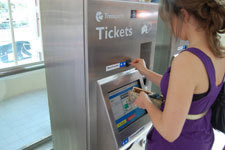
Install new ticket-vending machines (TVM) View image for cash ticket sales at train stations on the Mandurah Line and replace existing machines at other train stations. |
152 new TVMs were installed at the new Mandurah Line stations and at 42 of the other 60 stations on the network. |
|
Encourage the use of public transport for special events. |
The ongoing agreement for joint ticketing with the West Australian Football Commission continues into its second year, with all football and events patrons at Subiaco Oval having a public transport entitlement in their ticket/membership. This year saw the transition for southern suburbs passengers to travel to and from the football at Subiaco Oval with direct services by train. Other major events supported during the year included Anzac Day services, the Christmas Pageant, Skyworks, the Australian Surf Life Saving Championships, the Red Bull Air Race, World Masters Swimming Championships, the Perth Royal Show and the Freeway Bike Hike for Asthma. |
|
Continue to pursue patronage growth, high passenger satisfaction, and a high level of on- time running. |
Continuing the trend of the past eight years, fare-paying boardings on the Transperth system increased by 10.1 per cent, while total boardings* rose 7.8 per cent. The main contributing factor to this impressive growth in patronage was the new Mandurah Line, which increased fare-paying boardings on the train network by 25.6 per cent and total boardings by 19.2 per cent. |
key service measures
Patronage and services provided
Patronage on the Transperth system continued to record excellent growth, and was significantly boosted from late December by the opening of the new Mandurah Line. In 2007/08, total boardings increased by 7.8 per cent to 108.794 million from 100.926 million in 2006/07, and fare-paying boardings rose 10.1 per cent to 68.231 million from 61.980 million.
Passenger place kilometres also increased substantially. This metric is based on service kilometres and the average capacity of the fleet, and represents the total passenger carrying capacity provided on the Transperth bus, train and ferry network.
In 2007/08, total system passenger place kilometres recorded an increase of 25 per cent compared to a 3.3 per cent increase in 2006/07. In the five-year period from 2003/04, total capacity on the Transperth system increased by 46 per cent. Capacity on the train network expanded significantly between 2004/05 and 2005/06 following the establishment of new stations at Clarkson, Greenwood and Thornlie and the introduction into service of three and six-car trains. The 24 December 2007 start of services on the new Mandurah Line resulted in a 44.4 per cent increase in train service kilometres in 2007/08, and a 53.4 per cent increase in train passenger place kilometres. The contribution of the bus network to growth in system passenger carrying capacity was relatively modest. In 2007/08, following a 1.9 per cent increase in service kilometres, bus passenger place kilometres increased by 1.3 per cent.
Access to public transport
The graph highlights the relative ease with which the community can access Transperth services. The ease of access is represented by the proportion of street addresses in the Perth Public Transport Area that are within walking distance (500m) of a Transperth bus stop or train station – considered as an Acceptable Service Level (ASL). Due to Transperth’s use of modern technology, all bus stops and train stations are precisely located using a Global Positioning System (GPS). This enables the level of accessibility to public transport facilities to be measured against other spatial data, in this case property street addresses. In addition, Transperth has imposed a minimum of ASL, where every stop is assessed as to whether it has a 20-minute or better service in the peak flow direction during peak and at least an hourly service throughout the core of the day.
The increase to 78.3 per cent this year from a relatively static base for a number of years was due to the new Mandurah Line and in particular the expanded southern suburbs feeder bus network. The number of Transperth boarding points (bus stops and train stations) with an ASL rose 12.2 per cent from 5969 to 6698.
Reliability
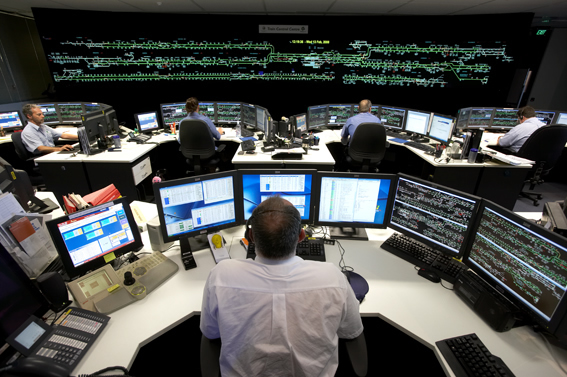
The OTR of Transperth bus and ferry services is monitored using the GPS reporter functionality of the SmartRider ticketing system. For trains, on-time running is recorded through the train control system. View image These new technology-based developments represent more precise methods of gathering data than the physical checks previously used for buses and ferries, and the manual observations and recordings by train control staff. Therefore, while actual on-time running may not have varied significantly, the higher level of recording precision now available has resulted in a decline in the proportion of services meeting their reliability targets.
Passenger satisfaction
An independent market research firm commissioned by Transperth carries out the annual PSM, to assess the level of satisfaction/dissatisfaction among passengers in regard to various aspects of Transperth services. The above graph shows the proportion of respondents who expressed satisfaction with the overall level of service on Transperth bus, train and ferry services, calculated as the weighted average across all modes. The small reduction in the overall satisfaction level recorded in 2008 was due to the decline in the level of satisfaction with Transperth’s bus services, particularly frequency of buses on weekends.
Passenger safety
Note: Measures relating to customer perception of safety at other times and at stations/interchanges are shown in sections dealing with individual modes.
The PSM assesses customer perception of safety during the day and at night, on-board buses, trains and ferries, and at bus and train stations and ferry jetties. The graph shows that nearly all passengers feel safe aboard Transperth buses, trains and ferries during the day.
Efficiency
In 2007/08, Transperth system total cost per passenger kilometre fell 19.3 per cent from $0.93 to $0.75 following a 4.7 per cent decline in total costs and a 17 per cent increase in passenger kilometres.
The decline in total costs was due to the abolition of the Capital User Charge (CUC) which, in 2006/07, accounted for 29 per cent of total train costs, three per cent of total bus costs and 17.7 per cent of total system costs. Excluding the CUC, the cost per passenger kilometre in 2006/07 was $0.76. Due to passenger kilometres increasing by 17 per cent, from 622.2 million in 2006/07 to 728.2 million, the cost per passenger kilometre in 2007/08 decreased to $0.75.
The significant increase in system passenger kilometres was due to the extension of the rail network to Mandurah. The new line helped increase train fare-paying boardings by 25.6 per cent, resulting in train passenger kilometres increasing by 35 per cent from 271.6 million in 2006/07 to 366.6 million. Bus passenger kilometres also increased, by a relatively modest 3.1 per cent.
Expenditure and revenue
In 2007/08, total expenditure on the Transperth system fell by 4.7 per cent due to the abolition of the CUC. While total train costs fell by 14.1 per cent, bus and ferry total costs increased by 7.2 and one per cent respectively.
Excluding the CUC, total system cost in 2006/07 was $475 million, 17.6 per cent less than the reported figure of $577.1 million. Therefore, the system total cost of $549.7 million in 2007/08 represents an increase of 15.8 per cent over the total ex-CUC cost in 2006/07. Train costs, excluding the CUC, recorded an increase of 21.7 per cent, and bus costs (also excluding the CUC) increased by 10.3 per cent.
The system operating cost (which excludes capital charges on long-life infrastructure) increased by 16.7 per cent in 2007/08. Train services recorded an increase of 26.2 per cent, while bus and ferry operating costs increased by 10.1 per cent and 1.4 per cent respectively.
The system total cost (excluding the CUC) increased in 2007/08 due mainly to:
- Energy costs on train services increasing by 35.5 per cent, train staff costs including security increasing by 36 per cent, and a 37.5 per cent increase in the cost of railcar maintenance.
- Fuel costs for bus services increasing by 17 per cent, and bus wage costs increasing by 4.3 per cent.
- Set-up costs for the bus feeder services along the Mandurah Line.
- Annual capital charges on train services (excluding the CUC) increasing by 13.9 per cent.
In 2007/08, fare-paying revenue and total revenue both recorded significant increases, of 25.4 per cent and 26.5 per cent respectively. Fare revenue includes funding for the Perth CAT service View image and contributions for specific bus services paid to Transperth in lieu of fares, while total revenue takes into account, in addition to fare revenue, other income comprising of advertising, rent, infringements, etc. The increase in fare revenue was due to the significant growth in system fare-paying boardings (10.1 per cent) and higher fares (4.8 per cent higher on average compared to 2006/07).