transperth trains
Description of services
The Transperth Train Operations (TTO) division operates an electrified suburban train system with more than 1140 services on an average weekday, and more than 7100 weekly services.
At 30 June 2008, the system covered 173.1km of track with 70 stations on five lines, and a fleet of 189 railcars which can be coupled in configurations of two, three, four or six-car trains.
The train network consists of the Joondalup Line (33.2km), the Fremantle Line (19km), the Midland Line (16km), the Armadale/ Thornlie Line (30.5km and a 3km spur line to Thornlie), and the Mandurah Line (71.4km).
The year’s developments
- The new Mandurah Line, 71.4km of double-track railway from Perth to Mandurah, was officially opened on 23 December 2007, with the first paying passengers carried on 24 December 2007. To integrate the new Mandurah Line into the network, major line closures were required in October 2007, affecting the Joondalup and Fremantle lines. This allowed the Joondalup Line to be aligned to Perth Underground and Esplanade stations, in preparation for through-running on to the new Mandurah Line. The two new underground stations were brought into service on 15 October 2007 when the lines were re-opened.
- Work on the underfloor railcar wheel lathe at Nowergup Depot, designed to re-machine railcar wheels to their original profile, and associated infrastructure works, neared completion during the year. The wheel lathe, which was installed in January 2008, will allow re-machining to be carried out in the inter-peak period and fast turnaround of railcars.
- Programs to upgrade passenger information and improve passenger safety were ongoing.
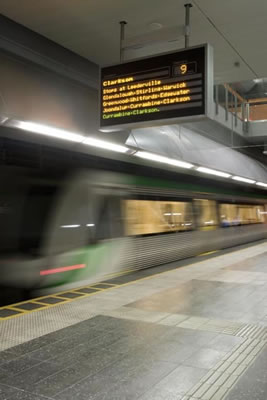
- Installation of the Customer Information System (CIS) View image continued during the year. This passenger information display system, a component of the PTA’s new train control system, has replaced older technology at some existing bus/rail interchange stations, as well as providing new information hardware at all stations on the Mandurah Line. The CIS provides passengers with accurate, up-to-date and timely information on train services. It uses a combination of electronic displays and public address announcements, which are automatically generated. The station displays include information to enable bus drivers to improve coordination of bus departures with train arrivals. The installation of the equipment started in May 2007 with completion planned for August 2008.
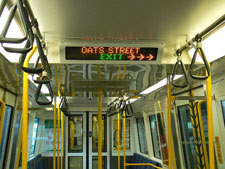
- The Recording and Passenger Information Dissemination (RAPID) View image system was installed on a further 15 A-series railcar sets during the year, bringing the number of two-car trains completed to 34 out of a total A-series fleet of 48. RAPID incorporates the latest in digital technology, increases the number of railcar security cameras, provides passenger information displays in the railcars and provides improved message announcements. The upgrade program is expected to be completed in 2009/10.
- TTO continued to recruit and train new railcar drivers, transit officers, customer service assistants and passenger ticketing assistants, mainly for deployment on the Mandurah Line.
- Both the Adopt-a-Station and Right Track programs for school students continued during the year. The former seeks to encourage community ownership of stations with a view to reducing incidents of vandalism; the latter, which is designed for students in years five to 12, addresses issues of trespass, vandalism and antisocial behaviour at train stations and on trains.
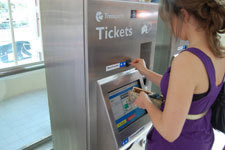
- New cash TVMs View image were installed at 51 train stations.
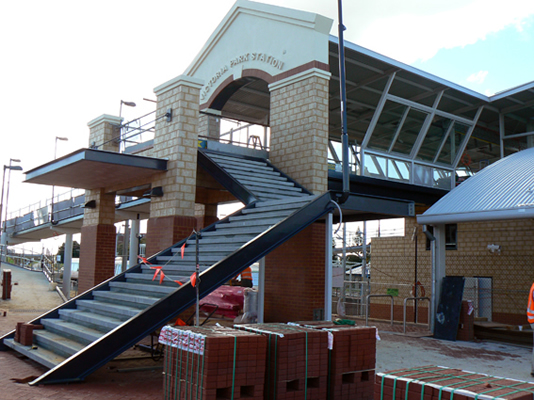
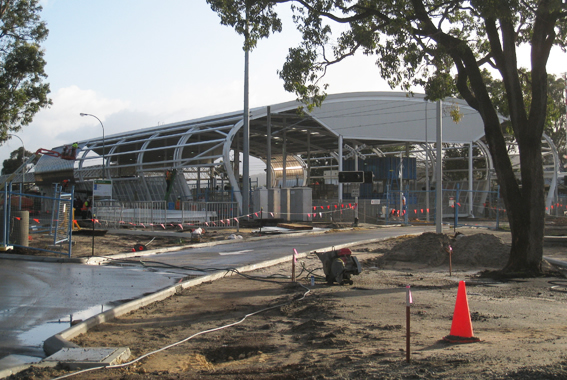
- Work started on a new station at Victoria Park, View image due for completion in August 2008; and on an upgrade of Kelmscott Station, View image due for completion late in 2008.
- Over recent years train service kilometres have continued to grow. Following the expansion of train services, service kilometres increased from 6.7 million in 2003/04 to 7.167 million in 2004/05 (up seven per cent), 8.138 million in 2005/06 (13.6 per cent), and 8.408 million in 2006/07 (3.3 per cent). In 2007/08, the introduction of the Mandurah Line resulted in a substantial 44.4 per cent increase to 12.138 million.
- Similarly, total capacity provided on the train network continued to increase, from 2090.4 million passenger place kilometres in 2003/04 to 2293.6 million (up 9.7 per cent in 2004/05), 2823.3 million in 2005/06 (23.1 per cent) and 2998.3 million in 2006/07 (6.2 per cent). With the opening of the Mandurah Line, passenger place kilometres increased by 53.4 per cent to 4600.8 million in 2007/08.
Cost of the service
In 2007/08, the total cost of providing Transperth train services, including annual capital charges, was $276.780 million, down 14.1 per cent from $322.279 million in 2006/07. However, the total cost in 2006/07 included the CUC ($94.881 million), which was abolished from 2007/08. Excluding the CUC, the total cost in 2006/07 was $227.398 million, which means the 2007/08 cost represents an increase of 21.7 per cent. Between 2006/07 and 2007/08, annual capital charges (excluding the CUC) increased 13.9 per cent from $83.049 million to $94.577 million, while operating costs (excluding capital charges) recorded an increase of 26.2 per cent, from $144.349 million to $182.203 million.
The expansion of the rail network to Mandurah resulted in a significant increase in rail operating costs. Compared to 2006/07, energy costs increased by 35.5 per cent, staff costs including security by 36 per cent and the cost of railcar maintenance by 37.5 per cent.
Patronage
Patronage on Transperth train services increased for the fourth year in succession and in 2007/08 recorded one of the highest-ever growth rates. Fare-paying boardings increased by 25.6 per cent, from 22.659 million in 2006/07 to 28.458 million, while total boardings rose 19.2 per cent from 35.758 million to 42.636 million.
The significant increase of 25.6 per cent in fare-paying boardings in 2007/08 followed increases of 6.3 per cent in 2004/05, 4.8 per cent in 2005/06 and 7.9 per cent in 2006/07. Patronage growth in 2007/08 was due largely to the introduction of the Mandurah Line which, during six months of operation contributed around 28 per cent of fare-paying boardings while the Joondalup Line accounted for 27 per cent.
In 2007/08, the rate of increase in total boardings was less than the increase in fare-paying boardings – 19.2 per cent compared with 25.6 per cent – which means the number of transfer boardings declined. A similar feature was noted in 2006/07 when fare-paying and total boardings increased at rates of 7.9 per cent and 4.8 per cent respectively. The decline in transfer boardings was due to more patrons being able to access the rail network directly following the provision of improved Park ‘n’ Ride facilities at stations. At 30 June 2008, there were 5570 parking bays on the Joondalup Line and 5408 on the Mandurah Line.
In 2007/08, though fare-paying boardings increased by 25.6 per cent, fare-paying boardings per service kilometre fell 13 per cent from 2.695 to 2.345 because of a 44.4 per cent increase in service kilometres. Similarly, while total boardings increased by 19.2 per cent, total boardings per service kilometre fell 17.4 per cent from 4.253 to 3.513.
Passenger satisfaction
The 2008 Transperth PSM showed that the proportion of users who expressed satisfaction with the train system overall increased to 90 per cent in 2008 from 87 per cent in 2007.
The importance rating of the service characteristics of Transperth’s train services (other than passenger safety) and the level of satisfaction/dissatisfaction for each key service characteristic are shown in the table below. In 2008, among the top 10 service characteristics, provision of electronic ticketing facilities replaced easy access to ticket purchasing facilities. The survey shows there was an increase in the satisfaction rating for each of the key service characteristics and, except in the case of “cleanliness on board”, the level of dissatisfaction had declined.
| Service characteristic | Importance rating | Satisfaction rating | ||
|---|---|---|---|---|
|
2007 |
2008 |
2007 |
2008 |
|
|
Cost of fares |
74% |
71% |
64% (9%) |
67% (8%) |
|
Speed of the trip |
73% |
64% |
91% (4%) |
93% (2%) |
|
Punctuality of the train service |
69% |
63% |
88% (6%) |
90% (5%) |
|
Cleanliness on board |
61% |
60% |
86% (5%) |
87% (6%) |
|
Availability of seats |
60% |
55% |
74% (18%) |
80% (14%) |
|
Number of trains during the day |
53% |
51% |
86% (5%) |
87% (5%) |
|
Number of trains during peak times |
56% |
50% |
81% (13%) |
82% (10%) |
|
Provision of electronic ticketing facilities |
- |
37% |
- |
90% (5%) |
|
Easy access to ticket purchasing facilities |
46% |
- |
82% (10%) |
- |
Note: Dissatisfaction level shown in parenthesis.
Passenger safety
One of the more significant outcomes of the PSM (conducted March/April 2008) was a positive improvement for customer views on train security. Train users were asked: “How safe do you generally feel from personal interference or threat from other passengers?”
The above graph shows the proportion of respondents who “always feel safe” or “usually feel safe” at the specified times locations.
The results for the past five years show that the proportion of train passengers who generally felt safe on trains and at station/interchanges during the day has remained high. The proportion of train users who generally felt safe on the train at night fell from 79 per cent in 2004 to 75 per cent in 2005, 74 per cent in 2006 and 71 per cent in 2007. In 2008, in a pleasing result, this declining trend in customer confidence regarding security was reversed, with 78 per cent of respondents indicating that they felt safe “always” or “usually.” Similarly, the proportion of respondents who generally felt safe at stations/interchanges at night – which had declined from 63 per cent in 2006 to 58 per cent in 2007 – chalked up a significant increase to 68 per cent, reflecting the PTA’s investment in train security measures.
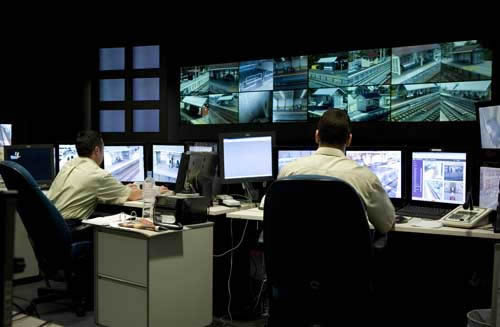
The PTA is committed to ensuring all passengers feel safe on the network at all times. There is centralised monitoring of digitised CCTV footage from all train stations via a state-of-the-art monitoring centre View image which is manned 24 hours a day seven days a week.
To improve the capacity of transit officers in their security and customer safety role, an improved Oleoresin Capsicum spray has been issued to transit officers, which has had a positive impact in deterring anti-social behaviour. Banning orders were introduced during the year, which will allow repeat offenders guilty of violence, graffiti, vandalism or anti-social behaviour to be banned from using public transport services.
To achieve full transit officer manning levels, an active recruiting program continued during the year, which included the establishment of a recruitment website www.transitofficer.wa.gov.au.
Major initiatives for 2008/09
- Continue rollout of RAPID system to the remaining A-series railcars.
- Complete installation of the wheel lathe at Nowergup.
- Complete installation of CIS.
- Continue recruitment of staff to service customer needs on the system.
- Commence taking delivery of 15 new three-car trains from January 2009.