- Home
- Governance and Compliance
- Key Performance Indicators
Key performance indicators –
Financial targets: Actuals compared to budget targets
The following table provides a comparison of the financials targets and outcomes against criteria included in the Resource Agreement between the Chief Executive Officer, Minister for Transport and the Treasurer.
| 2013-14 Target $000 |
2013-14 Actual $000 |
Variation $000 |
||
|---|---|---|---|---|
| Total cost of services | 1,217,907 | 1,236,590 | 18,683 | Note 1 |
| Net cost of services | 933,287 | 968,107 | 34,820 | Note 2 |
| Total Equity | 4,723,553 | 4,734,044 | 10,491 | |
| Net increase/(decrease) in cash held | (36,248) | 48,478 | 84,726 | Note 3 |
| Number of FTEs | Number of FTEs | Number of FTEs | ||
| Full time equivalent | 1,563 | 1,527 | (36) | Note 4 |
Note
-
1. Total cost of services
Since the 2013-14 budget was set, PTA's Operating Subsidy was increased by $9.78 million in the Mid Year Review process. The difference between the amended 2013-14 budget ($1,227 million) and actual expenditure ($1,237 million) is mostly attributable to the write-off of assets which is a non-cash item.
-
2. Net cost of services
Since the 2013-14 budget was set, PTA's Net Cost of Services was increased by $30 million due to an increase in PTA's Operating Subsidy - $10 million as referred to in the previous point and $20 million approved by EERC to offset revised (lower) fare revenue.
-
3. Net increase in cash held
The net increase in cash held is due to 2013-14 revenue exceeding budget by about $9 million, cash transferred in from other government agencies of $34.159 million and delays in delivering PTA's approved Asset Investment Program.
-
4. Full time equivalent
The total PTA target was set at 1,563 FTE, the variance is mostly attributable to vacant Transit Officer positions and the freeze on advertising vacant positions in the last quarter of the financial year.
Summary Of Key Performance Indicators:
Actual Compared To Budget Targets
| 2013 - 14 Target | 2013 - 14 Actual | Variation | |
|---|---|---|---|
| Outcome: Accessible, reliable and safe public transport system | |||
| Key effectiveness indicators | |||
| Use of public transport - passengers per service kilometre: | |||
|
1.46 | 1.32 | -0.14 |
|
4.36 | 3.81 | -0.55 |
|
12.71 | 11.99 | -0.72 |
|
0.822 | 0.746 | -0.076 |
|
0.231 | 0.221 | -0.01 |
|
0.066 | 0.063 | -0.003 |
| Accessible public transport: | |||
| The proportion of street addresses within the Perth Public Transport Area which are within 500 metres of a Transperth stop providing an acceptable level of service | 85.00% | 84.58% | -0.42% |
| Metropolitan and regional passenger services reliability: | |||
|
75.00% | 81.22% | 6.22% |
|
95.00% | 94.93% | -0.07% |
|
85.00% | 97.83% | 12.83% |
| Country passenger rail and road coach services reliability: | |||
|
80% | 81% | 1.00% |
|
90% | 92% | 2.00% |
|
95% | 90% | -5.00% |
|
95% | 98% | 3.00% |
|
95% | 97% | 2.00% |
| Regional school bus services reliability: | |||
|
99.00% | 100.00% | 1.00% |
| Level of overall customer satisfaction - customer satisfaction index: | |||
|
81% | 83% | 2.00% |
|
90% | 89% | -1.00% |
|
98% | 97% | -1.00% |
|
92% | 90% | -2.00% |
| Customer perception of safety - independent external surveys: | |||
|
96% | 97% | 1.00% |
|
97% | 98% | 1.00% |
|
69% | 69% | 0.00% |
|
75% | 77% | 2.00% |
|
96% | 97% | 1.00% |
|
98% | 99% | 1.00% |
|
70% | 75% | 5.00% |
|
82% | 84% | 2.00% |
| Level of notifiable safety occurrences - notifiable occurrences: | |||
|
0.21 | 0.31 | 0.10 |
|
0.81 | 1.09 | 0.28 |
|
8.50 | 9.24 | 0.74 |
|
35.00 | 32.09 | -2.91 |
|
19 | 17 | -2 |
| Outcome: Protection of the long-term functionality of the rail corridor and railway infrastructure: | |||
|
Nil | Nil | Nil |
| Key efficiency indicators | |||
| Service 1 : Metropolitan and regional passenger services | |||
| Average cost per passenger kilometre | |||
|
$0.89 | $0.97 | $0.08 |
|
$0.42 | $0.46 | $0.04 |
|
$1.25 | $1.57 | $0.32 |
| Average cost per 1,000 place kilometres | |||
|
$73.91 | $70.93 | -$2.98 |
| Total passenger place kilometres (millions) | |||
|
230.346 | 241.311 | 10.965 |
| Service 2 : Country passenger rail and road coach services | |||
| Average cost per passenger kilometre | |||
|
$0.48 | $0.45 | -$0.03 |
|
$0.27 | $0.26 | -$0.01 |
| Service 3 : Regional school bus services | |||
| Average cost per contracted kilometre : School bus services | $3.73 | $3.68 | -$0.05 |
| Service 4 : Rail corridor and residual freight issues | |||
| Total cost of managing the rail freight corridor and residual freight issues (h) | $116,522,000 | $134,212,000 | $17,690,000 |
Note: For more explanations on the variation, please refer to the section Audited Key Performance Indicators.
- a. Passengers per service kilometre on train was 12.53% below the target as a result of a 9.05% reduction in patronage and a 4.04% increase in train service kilometres. This is mainly due to an abnormally high number of closures of the rail system resulting from works associated with the Perth City Link project, a slowing economy in 2013-14 and the introduction of additional three railcars into service.
- b. The on time running result of Transperth ferry in 2013-14 was 15.09% above the target as activity on the river was less disruptive during the year despite works carried out on Elizabeth Quay and allowed the ferry to achieve a significant improvement in service reliability compared to the target and the previous year's result.
- c. Category A incidents per million passenger boardings and per million train kilometres were 49.49% and 34.51% above the targets respectively mainly due to a 71.43% increase in notifiable occurrences under the "attempted or suspected suicide" category which are not under PTA's control.
- d. Regional school bus services notifiable occurrences were 10.53% below the target. Approximately 88% of the accident cases occurred through no fault of the school bus driver. No fatalities or serious injuries have been recorded.
- e. Bus average costs per passenger kilometre were 9.37% above the target mainly due to a 9.07% decrease in passenger kilometres resulted from a 7.28% decrease in passenger boardings and a 1.97% decrease in bus average trip length.
- f. Train average costs per passenger kilometre were 10.40% above the target mainly due to a 7.96% decrease in passenger kilometres resulting from a 9.05% reduction in patronage offset by a 1.42% increase in train average trip length.
- g. Ferry average costs per passenger kilometre were 25.88% above the target mainly due to a 16.45% increase in costs of services and a 7.24% decrease in passenger kilometres resulting from a 7.27% decline in ferry patronage compared to target.
- h. The total cost of managing the rail freight corridor and residual freight issues was 15.18% above the target mainly due to a net $13.5 million write-off of non-current assets.
Electoral Act 1907 – section 175ZE
In compliance with section 175ZE of the Electoral Act 1907, the Public Transport Authority of Western Australia is required to report on expenditure incurred during the financial year in relation to advertising agencies, market research organisations, polling organisations, direct mail organisations and media advertising organisations.
The details of the report are as follows:
| 2013-14 | |
|---|---|
| Expenditure with Advertising Agencies: | |
| 303 Lowe Group Pty Ltd | 755,939 |
| ADCORP Australia | 96,100 |
| Key 2 Creative | 77,380 |
| Definition Pty Ltd | 19,425 |
| Radiowest Broadcasters | 14,726 |
| Concept Media | 12,500 |
| Exposure Print and Design | 11,543 |
| Australia's South West | 8,821 |
| Graduate Careers Australia | 6,375 |
| ICON Illustrations | 5,981 |
| Countrywide Publications | 5,955 |
| Market Creations | 4,420 |
| Cooch Creative | 4,030 |
| Whiz Digital | 4,015 |
| Brandsense | 3,100 |
| Kalgoorlie Boulder Visitor Centre | 2,455 |
| Australia's Golden Outback | 1,991 |
| 1,034,756 |
| 2013-14 | |
|---|---|
| Expenditure with Market Research Agencies: | |
| Painted Dog Research | 267,164 |
| Expenditure with Polling Agencies: | Nil |
| Expenditure with Direct Mail Agencies: | Nil |
| Expenditure with Media Advertising Agencies: | |
| Carat Australia Media Services | 244,716 |
| Metropolitan Redevelopment Authority | 167,626 |
| 412,342 | |
| Total Expenditure | 1,714,262 |
Explanation of Major Capital Expenditure Variations 2013-14
(a) Budgeted estimates and actual results for 2013-14
| Budget $000 |
Actual $000 |
Variation $000 |
Comments | |
|---|---|---|---|---|
| New Perth Stadium Transport Project | 60,781 | 21,321 | 39,460 | Project scheduling |
| Perth City Link | 115,042 | 86,543 | 28,499 | Project saving |
| Grain Freight Re-sleepering Project | 54,618 | 31,869 | 22,749 | Project saving |
| Extension of Northern Suburbs Railway to Butler | 66,902 | 45,434 | 21,468 | Project scheduling and saving |
| Network and Infrastructure Upgrades | 26,400 | 14,540 | 11,860 | Project saving |
| Aubin Grove Station | 16,000 | 5,829 | 10,171 | Project saving |
| Bus Priority Projects | 5,997 | (558) | 6,555 | Project saving |
| Fremantle Swan River Bridge - Pier Protection | 5,932 | 425 | 5,507 | Project scheduling due to changed procurement strategy |
| Resilience Package | 8,000 | 2,570 | 5,430 | Project scheduling |
| Edgewater Multi-Storey Car Park | 5,225 | 476 | 4,749 | Project scheduling |
| New PTA Sub Station at City West | 18,775 | 15,001 | 3,774 | Project scheduling |
| DAVS Replacement | 6,433 | 2,726 | 3,707 | Project scheduling |
| Power sub-station and stow roads to support new railcars | 3,764 | 608 | 3,156 | Delays in development application approval |
| Disability Access for Minor Stations & Track Works | 9,221 | 6,610 | 2,611 | Project scheduling |
| Perth Station Building and Horseshoe Bridge Accommodation Works | 7,732 | 5,180 | 2,552 | Project scheduling |
| Development of Beenyup Bus Depot | 3,000 | 579 | 2,421 | Project scheduling |
| Business Support Upgrades | 5,389 | 3,416 | 1,973 | Project scheduling |
| Car Park Upgrade Program | 2,345 | 436 | 1,909 | Project scheduling |
| Forrestfield-Airport Link | - | 7,573 | (7,573) | Project approved post 2013-14 Budget Paper |
| Others | 121,629 | 120,390 | 1,239 | Project scheduling |
| Grand Total | 543,185 | 370,968 | 172,217 |
(b) Major Works in progress and completed
| 2013-14 Estimated Total Cost $000 |
Estimated Cost to Complete $000 |
Total cost of project Actual $000 |
Expected Year of Completion |
|
|---|---|---|---|---|
| Perth City Link | 609,269 | 163,135 | 405,580 | 2016/17 |
| Bus Acquisition and Replacement Program | 588,469 | 311,109 | 137,735 | 2018/19 |
| New Perth Stadium Transport Project | 358,641 | 331,885 | 26,756 | 2017/18 |
| Extension of Northern Suburbs Railway to Butler | 250,230 | 42,417 | 187,007 | 2014/15 |
| Purchase of 22 Railcars | 243,846 | 102,910 | 141,557 | 2016/17 |
| Grain Freight Re-sleepering Project | 171,420 | 0 | 145,017 | 2013/14 |
| Aubin Grove Station | 57,000 | 50,793 | 6,208 | 2016/17 |
| Better Transport System (3000 parking bays) | 50,022 | 1,896 | 52,843 | 2014/15 |
| Edgewater Multi-Storey Car Park | 46,482 | 46,006 | 476 | 2016/17 |
| Disability Access for Minor Stations & Track Works | 30,973 | 5,208 | 25,196 | 2014/15 |
| Bus Priority Projects | 25,183 | 10,870 | 11,721 | 2016/17 |
| Forrestfield-Airport Link | 0 | 2,013,427 | 7,573 | 2019/20 |
Audited Key Performance Indicators
Certification of Key Performance Indicators
For the year ended 30 June 2014
I hereby certify that the key performance indicators are based on proper records, are relevant and appropriate for assisting users to assess the Public Transport Authority’s performance, and fairly represent the performance of the Public Transport Authority of Western Australia for the financial year ended 30 June 2014.
-

Reece Waldock
Accountable Authority
9 September 2014
Key Performance Indicators - Relationship to Government strategic goal
The following table depicts the relationship between the Government’s goals and the outcomes and services that the PTA provides in order to achieve those goals.
| Government Strategic Goal | PTA Outcomes | PTA Services |
|---|---|---|
| Results-Based Service Delivery: Greater focus on achieving results in key service delivery areas for the benefit of all Western Australians. |
Accessible, reliable and safe public transport system | 1. Metropolitan and Regional Passenger
Services 2. Country Passenger Rail and Road Coach Services 3. Regional School Bus Services |
| Protection of the long term functionality of the rail corridor and railway infrastructure |
4. Rail Corridor and Residual Freight Issues Management |
Note: The key performance indicators and the variances are calculated based on original source data and the results are reported with rounding to the nearest appropriate decimals.
Measuring performance
Outcome 1: Accessible, reliable and safe public transport system
Effectiveness Indicators
The PTA's effectiveness in providing an accessible, reliable and safe public transport system is measured using the following key effectiveness indicators for:
- 1. Use of public transport
- 2. Accessible public transport
- 3. Service reliability
- 4. Level of overall customer satisfaction
- 5. Customer perception of safety
- 6. Level of notifiable safety incidents.
Use of public transport
The use of public transport is measured by comparing the annual number of passengers carried with the number of service kilometres. Service kilometres are kilometres operated on scheduled passenger services and exclude "non-productive running" i.e. travelling to or from the depot to commence a service trip or re-positioning to commence another service trip.
The measure indicates the extent to which services provided, as represented by the number of kilometres operated, are being utilised. An increasing trend in the indicator will generally signify that patronage is rising at a rate greater than the rate of increase in service kilometres operated and represents an improvement in effectiveness as well as an increase in the use of public transport.
This effectiveness indicator is applied to each mode of public transport. The indicator is based on total boardings on Transperth services and includes fare-paying boardings plus free travel and transfers. Transfers are boardings which occur either between services within the same mode or between modes during the specified ticket transfer time.
Transperth bus services
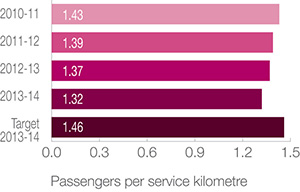
Passengers per service kilometre on Transperth bus was 3.83 per cent below the 2012-13 result and 9.46 per cent below the 2013-14 target.
Total boardings reached 83.714 million in 2013-14 compared to 83.543 million in 2012-13 and the target of 90.290 million, an increase of 0.20 per cent over 2012-13 and 7.28 per cent below the target.
Since 2010-11 there has been a gradual annual decline in passengers per service kilometre, brought about largely by a large annual increase in the bus service kilometres rolled out since 2011-12. Whilst this roll out of additional service kilometres has made public transport more accessible to many more areas and people, the volume of new passenger utilising the new services, much of which is new and expanding outer suburbs, is less than in the more densely populated inner suburbs. This, coupled with the slowing economy in 2013-14, which has seen a general decline in public transport patronage, and an abnormally high number of closures of the rail system (which is fed by bus services) as a result of the works associated with the Perth City Link project, resulted in an even greater decline of this indicator in 2013-14.
Transperth train services
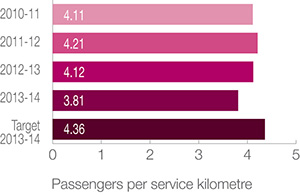
Passengers per service kilometre on Transperth train was 7.37 per cent below the 2012-13 result and 12.53 per cent below the target.
Total boardings reached 63.492 million in 2013-14, 3.35 per cent below the 2012-13 result of 65.689 million and 9.05 per cent below the 2013-14 target of 69.809 million.
The decline in passengers per service kilometre from 2012-13 and the variance to the 2013-14 target is due to an abnormally high number of closures of the rail system that resulted from works associated with the Perth City Link project and a slowing economy in 2013-14 which has seen a general decline in public transport patronage. This impact of reduction in patronage was compounded by a 4.34 per cent increase in train service kilometres resulting from the introduction of an additional three railcars into service.
Train service kilometres reached 16.648 million kilometres compared to 15.956 million in 2012-13, an increase of 4.34 per cent over 2012-13 and 4.04 per cent above the target.
Regional town bus services
Intra-town services operate within rural town boundaries, while inter-town services run between regional centres.
Intra-town and inter-town service
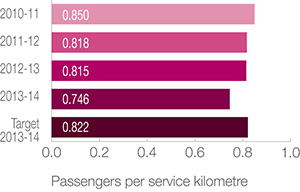
Passengers per service kilometre reached 0.746, 8.55 per cent below the 2012-13 result and 9.28 per cent below the target in 2013-14.
The reason for the decrease is while total service kilometres increased 11.31 per cent to 3.402 million from 3.057 million in 2012-13, total boardings only increased 1.80 per cent to 2.537 million from 2.493 million in 2012-13.
In 2013-14, intra-town service kilometres increased by 12.48 per cent to 2.961 million kilometres from 2.632 million in 2012-13 while patronage increased by 1.78 per cent due mainly to expanded services that were introduced on a trial basis in Bunbury and Geraldton. The service changes were introduced in Bunbury in March 2013, but the full year impact of the increase in service kilometres was felt in 2013-14, while the changes were implemented in Geraldton effective from July 2013.
Inter-town service kilometres increased by 4.05 per cent to 441,550 from 424,376 in 2012-13 while patronage increased by 7.71 per cent as a result of the expansion of the Roebourne community bus service in November 2013 and also the strong performance of the Pilbara 4WD bus service during 2013-14. This service provides a connection between the Pilbara towns of Newman, Marble Bar, Nullagine and Port Hedland.
Transperth ferry services
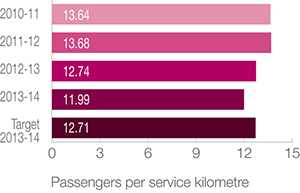
Passengers per service kilometre reached 11.99, 5.86 per cent below the 2012-13 result of 12.74 and 5.63 per cent below the target of 12.71.
During the year, total boardings reached 434,914, 6.38 per cent below the 2012-13 result of 464,542 and 7.27 per cent below the 2013-14 target of 469,000 mainly due to a general decline in public transport due to a slowing economy and in part due to service disruptions caused by work on the Elizabeth Quay.
Service kilometres were 1.74 per cent below the target of 36,900 kilometres and marginally (0.55 per cent) below the 2012-13 result.
Transwa rail services
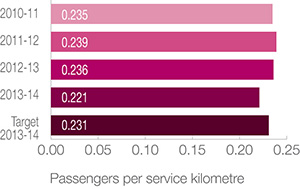
Passengers per service kilometre reached 0.221, 6.07 per cent below the 2012-13 result of 0.236 and 4.16 per cent below the target of 0.231 in 2013-14.
During the year, service kilometres decreased slightly (0.30 per cent) from 992,274 kilometres in 2012-13 to 989,300 kilometres and were 2.20 per cent below the target of 1,011,564. The decrease can be attributed to the larger than projected track work carried out on the Australind line.
Patronage also decreased by 6.35 per cent from 233,877 in 2012-13 to 219,030 in 2013-14 and was 6.28 per cent below the target of 233,700 mainly due to a 6.90 per cent decrease in Prospector patronage and a 5.81 per cent decrease in Australind patronage. The Prospector patronage was largely affected by the absence of the Intermediate Car which was extensively damaged by fire in August 2013. This meant that the railcar was made up of two car sets instead of the more flexible three car sets.
Transwa road coach services
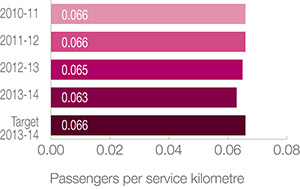
Passengers per service kilometre reached 0.063, 2.57 per cent below the 2012-13 result of 0.065 and 4.16 per cent below the 2013-14 target of 0.066.
This was due to a 5.62 per cent decline in patronage from 208,954 in 2012-13 to 197,211 in 2013-14 and a 3.13 per cent decrease in service kilometres from 3.219 million kilometres in 2012-13 to 3.118 million in 2013-14 mainly due to the termination of the three on-demand (Boxwood Hill to Bremer Bay, Quairading to Narembeen and Ravensthorpe to Hopetoun) and two charter (Northam to Mukinbudin and Albany to Ravensthorpe) road coach services.
Accessible public transport
Accessibility to public transport, in terms of service coverage, is measured as the proportion of Property Street Addresses (PSA) within the Perth Public Transport Area (PPTA) which are within 500 metres of a Transperth stop providing an acceptable level of service. The PPTA defines the core operational areas for Transperth services.
Acceptable Service Level (ASL) is defined as an hourly service during the day with at least three trips per hour (i.e. at 20-minute intervals) in the peak flow direction in the morning and/or afternoon peaks, excluding dedicated school bus services.
The indicator uses PSA data from Landgate and service information and stop location data from the Transperth Route Information System (TRIS).
The measure demonstrates the extent to which the PTA meets its accessibility standards in the Perth metropolitan area.
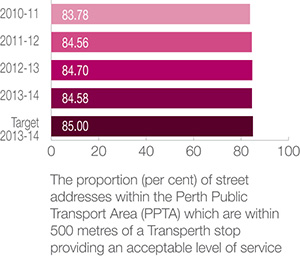
Accessibility to public transport decreased by 0.14 per cent from 2012-13 and was 0.49 per cent below the target. In 2013-14, the number of PSAs within the PPTA increased by 1.18 per cent to 926,050 from 915,252 in 2012-13. The number of PSAs within 500 metres of an ASL stop also increased by 1.03 per cent to 783,270 from 775,253 in 2012-13.
The 2013-14 result indicates that a very high proportion of PSAs in Perth, 783,270 out of 926,050 (84.58 per cent) have ready access to an acceptable level of public transport services.
Service reliability
According to an independent survey which measured customer satisfaction, service reliability is regarded as one of the most significant characteristics of a quality service. Service reliability is essentially a combination of two main factors, punctuality and consistency.
Services are considered to be punctual if they arrive within a defined period of time after the scheduled arrival time. This parameter is referred to as “On Time Running” (OTR).
| Operation | OTR parameter |
|---|---|
| Metropolitan and Regional Passenger Services | |
| Transperth trains | 4 minutes |
| Transperth buses | 4 minutes |
| Transperth ferries | 3 minutes |
| Country Passenger Rail and Road Coach Services | |
| Transwa rail | |
|
15 minutes |
|
10 minutes |
|
10 minutes |
|
10 minutes |
| Road Coaches | 10 minutes |
| Regional school bus services | |
| Drop off no less than 10 minutes before school starts and pick up within 10 minutes of school ending. | |
The OTR measure demonstrates the extent to which the PTA meets its service reliability standards.
Transperth train services
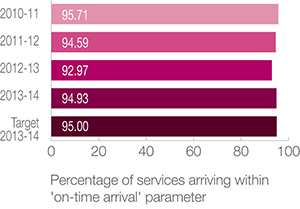
The OTR of Transperth Trains in 2013-14 reached 94.93 per cent, 2.11 per cent above the previous year’s result and marginally (0.07 per cent) below the 2013-14 target.
Factors affecting service reliability include mechanical issues with railcars, passenger related delays causing longer dwell times at stations and bad weather which resulted in slippery track conditions and trains travelling at a reduced speed.
In 2013-14, the number of cancelled and delayed services decreased significantly compared to 2012-13. The number of delays due to bad weather decreased by 49.8 per cent while passenger related delays decreased by 31.1 per cent.
Transperth bus services
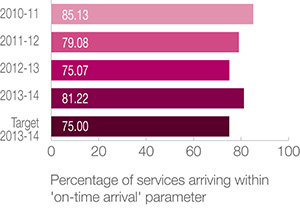
The OTR of Transperth bus in 2013-14 reached 81.22 per cent, 8.20 per cent above the 2012-13 result and 8.30 per cent above the target. A significant improvement in bus service reliability was achieved following the completion of major road works which had impacted adversely on bus services during 2012-13.
Transperth ferry services
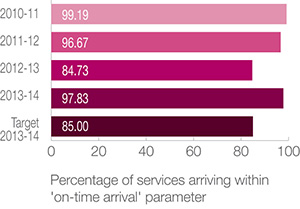
The OTR of Transperth ferry in 2013-14 reached 97.83 per cent, 15.45 per cent above the 2012-13 result of 84.73 per cent and 15.09 per cent above the target of 85 per cent. Despite the disruptions caused by works on Elizabeth Quay, activity on the river was less disruptive during the year and allowed the ferry to achieve a significant improvement in service reliability compared with the previous year. Of the 138 trips checked during 2013-14, 135 trips have met the target of three minutes.
Transwa rail services
Indicators of the OTR performance for Transwa rail services are reported separately for each service.
a. Prospector
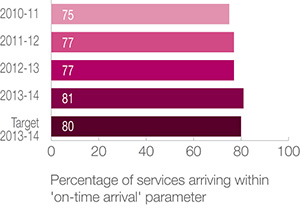
The OTR of the Prospector reached 81 per cent in 2013-14, 4.81 per cent above the 2012-13 result and 0.98 per cent above the 2013-14 target of 80 per cent. The target and previous years results were exceeded due to less crossing concerns for the Prospector train.
b. Australind
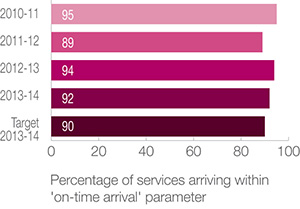
The OTR of the Australind in 2013-14 reached 92 per cent, 1.63 per cent below the 2012-13 result and 2.26 per cent above the target. The OTR over the past two financial years has been achieved by a significant reduction in the number of services delayed due to crossings. The introduction of Burekup as a crossing siding has improved the ability for the Australind to maintain on time running. During the year, larger than projected track work was carried out on the Australind line.
c. AvonLink
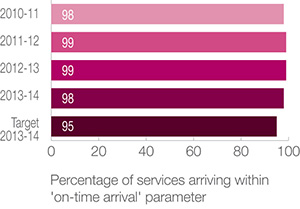
The OTR of the AvonLink in 2013-14 remained high at 98 per cent, 1.61 per cent below the 2012-13 result and 2.74 per cent above the target of 95 per cent in 2013-14. The OTR has been achieved given the AvonLink operates on a double line railway and commensurate with a timetable suited to the operations.
d. MerredinLink
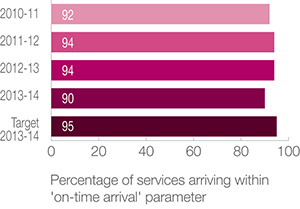
The OTR of the MerredinLink in 2013-14 reached 90 per cent, 3.74 per cent below the 2012-13 result and 4.83 per cent below the target of 95 per cent in 2013-14 mainly due to service delays associated with the inherent issue of operating a passenger train on a predominantly freight line i.e. crossings. Delays were also caused by track and signal irregularities.
Transwa road coach services
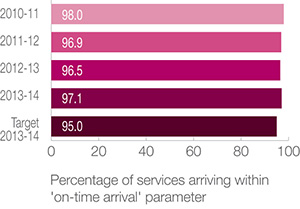
The OTR of the road coach services in 2013-14 reached 97.1 per cent, 0.55 per cent above the 2012-13 result and 2.17 per cent above the target.
Regional school bus services
This indicator measures school bus timetable reliability for rural mainstream services and special education school buses operating in the metropolitan area. The OTR parameter is to arrive at school no less than 10 minutes before school starts and depart within 10 minutes of school ending.
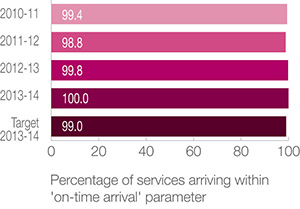
The OTR in 2013-14 reached 100 per cent, 0.24 per cent above the 2012-13 result and 1.01 per cent above the target.
In 2013-14, 693 mainstream and education support services were randomly monitored for on-time running of which 693 were within the time standard. The number of observations was within the acceptable limit of sampling error rate.
This indicator is calculated using a random sample which ties in with the School Bus Service inspection program.
The table shows five year performance to 30 June 2014:
| Year | Number of observations for compliance with ‘on-time’ arrival |
Observations that were compliant |
|---|---|---|
| 2009 -10 | 888 | 864 |
| 2010 -11 | 976 | 970 |
| 2011 -12 | 647 | 639 |
| 2012 -13 | 844 | 842 |
| 2013 -14 | 693 | 693 |
The error rate of ± 3.05 per cent is within the ± 5 per cent tolerance level.
Level of overall customer satisfaction
The proportion of patrons who expressed overall satisfaction with their public transport service level, measures the public perception of Transperth’s performance in providing a high-quality and attractive public transport service.
The measure for Transperth services is derived from an extensive annual survey conducted by independent pollsters. The survey, known as the Passenger Satisfaction Monitor (PSM), provides an objective, unbiased view over time of patrons’ overall satisfaction with the system, e.g. safety, on-time running, courtesy of staff, service frequency and station amenities. The information is used by Transperth to develop strategies for improving service performance and infrastructure.
The pollsters interview a large sample of passengers in lengthy face-to-face surveys. Interviewers are assigned to various services and transit station locations over a four week period covering the working week and weekend.
Transperth train services
For the train PSM, a total of 980 train patrons were surveyed. The overall sample comprised of:
- Adults aged 18 years or older, residing within the Perth metropolitan area;
- Current users of Transperth train services (excluding school students); and
- Patrons who travel on trains at least once per fortnight.
The sample error estimate was within ± 3 - 4 per cent and represents score differences required to reach the 95 per cent confidence level.
Overall satisfaction increased by 5.95 per cent from 2012-13 but was 1.11 per cent below the target.
The results were driven largely by a 8.75 per cent increase in overall satisfaction of peak-time travellers (from 80 per cent in 2012-13 to 87 per cent in 2013-14).
The level of dissatisfaction decreased significantly by 57.14 per cent from 7 per cent in 2012-13 to 3 per cent in 2013-14.
The main reasons for dissatisfaction related to crowding issues and seat availability in peak times and insufficient railcars.
The increased satisfaction and reduced dissatisfaction is due to reduced crowding resulting from the introduction of three new railcars and a decline in patronage in 2013-14.
Transperth bus services
For the Transperth bus PSM, a total of 3,061 bus patrons were surveyed. The overall sample comprised of:
- Adults aged 18 years or older, residing within the Perth Bus Contract region;
- Current users of Transperth bus services (excluding school students); and
- Patrons who travel on bus at least once per fortnight.
The sample error estimate was within ± 2 – 3 per cent and represents score differences required to reach the 95 per cent confidence level.
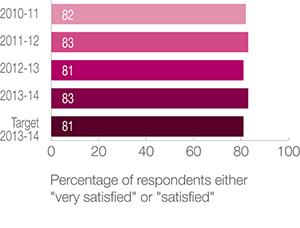
Overall satisfaction reached 83 per cent, 2.47 per cent above the 2012-13 result and the target in 2013-14 mainly due to significantly higher satisfaction levels recorded for the new 950 Superbus and all CAT services ranging from 92 per cent to 95 per cent.
Levels of dissatisfaction decreased from 9 per cent in 2012-13 to 8 per cent in 2013-14 (the lowest dissatisfaction level for the past nineteen years).
The most frequent reasons for dissatisfaction with the bus system in 2013-14 were issues relating to service frequency, punctuality, insufficient off-peak and weekend services and limited connection of buses and trains.
Transperth ferry services
For the Transperth ferry PSM, a total of 199 ferry patrons were surveyed. The overall sample comprised of:
- Adults aged 18 years or older, residing within the Perth metropolitan area, (i.e. patrons who were users of Transperth ferry services and used them at least once per fortnight for Perth residents)
- Patrons who were users of Transperth ferry services whilst visiting Perth.
- School students were excluded from the sample.
The sample error estimate was within ± 10 per cent and represents score differences required to reach the 95 per cent confidence level.
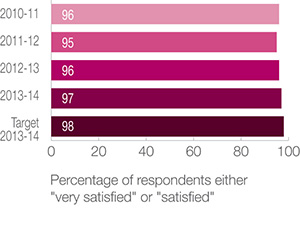
Customer satisfaction with the overall level of Transperth ferry services remained very high at 97 per cent, 1.04 per cent above the 2012-13 result and 1.02 per cent below the target.
In 2013-14, zero per cent of the respondents indicated that they were dissatisfied at the overall service level, thus maintaining the long-term trend of minimal or zero dissatisfaction with Transperth ferry services. The proportion of users who were ‘very satisfied’ with the Transperth ferry services increased to 70 per cent in 2013-14 compared to 69 per cent in 2012-13.
The key factors affecting the level of satisfaction were cleanliness on board, cost of fares, punctuality, service frequency on weekdays, speed of the trip, personal safety and seat availability.
Transwa train and road coach services
An independent passenger satisfaction survey is undertaken annually for each service: Australind, Prospector, AvonLink, MerredinLink and Road Coaches.
In 2013-14 a total of 1,244 country services patrons were surveyed via a self-completion questionnaire.
The sample error estimate was within ± 3 - 5 per cent and represents score differences required to reach the 95 per cent confidence level.
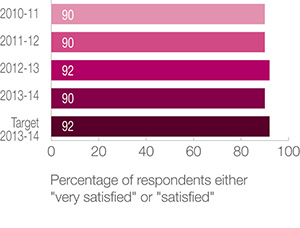
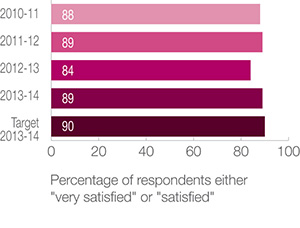
Overall satisfaction reached 90 per cent, 2.17 per cent below the 2012-13 result and the target of 92 per cent in 2013-14 mainly due to a 6.45 per cent decrease in overall satisfaction with the Prospector services from 93 per cent in 2012-13 to 87 per cent in 2013-14. Three areas of concern for the Prospector service were the speed of the trip, the quality of the food on board and the reliability of the entertainment system.
In 2013-14, overall satisfaction of AvonLink and MerredinLink increased by 11.90 per cent and 4.55 per cent respectively.
Customer perception of safety
Safety perceptions are an important factor in the public deciding whether to use public transport. The PTA is continuing to invest in security-related infrastructure and uses risk based resource allocation to enhance security staffing in specific areas of vulnerability. This increase in presence at strategic times and locations has ensured that customers can see the tangible measures being taken to increase their safety.
Customer perceptions of safety are measured through data gathered in the PSM which distinguishes between on-train and on-bus and at stations, at night and during the day for the Transperth train and bus services.
Transperth train services (per cent)
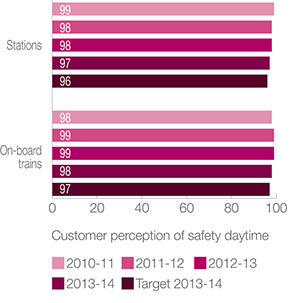
The indicator for perceived safety at train stations during the day reached 97 per cent, 1.02 per cent below the 2012-13 result and 1.04 per cent above the target of 96 per cent in 2013-14.
The indicator for perceived safety on-board trains reached 98 per cent, 1.01 per cent below the 2012-13 result and 1.03 per cent above the target of 97 per cent in 2013-14.
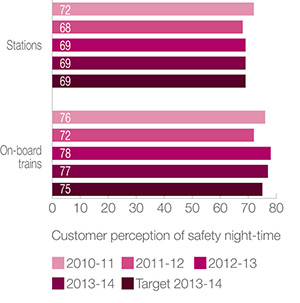
The indicator for perceived safety at train stations reached 69 per cent, same as the 2012-13 result and the target in 2013-14.
The indicator for perceived safety on-board trains reached 77 per cent, 1.28 per cent below the 2012-13 result of 78 per cent and 2.67 per cent above the target of 75 per cent in 2013-14 mainly due to ongoing measures taken by Transperth in 2013-14 to address security concerns following significant improvement in the perception of safety in 2012-13 particularly among the patrons on the Armadale line. These effective measures include:
- Risk-based resource allocation, ensuring a greater security presence on the Armadale line;
- Joint Police and PTA targeted operations and enhanced security coverage on late evening trains.
During the year, train services kilometres increased by 4.34 per cent while the number of security incidents per million boardings was marginally (0.79 per cent) above the 2012-13 results and 4.50 per cent below the target.
Transperth bus services (per cent)
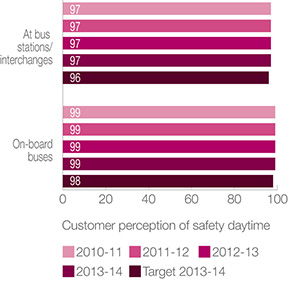
The indicator for perceived safety at bus stations during the day reached 97 per cent, the same as the 2012-13 result and 1.04 per cent above the target of 96 per cent in 2013-14.
The indicator for perceived safety on board buses reached 99 per cent, the same as the 2012-13 result and 1.02 per cent above the target of 98 per cent in 2013-14.
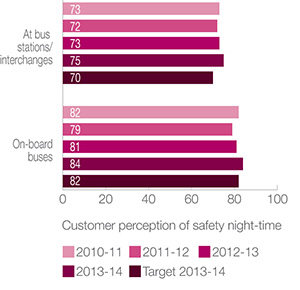
The indicator for perceived safety at bus stations reached 75 per cent, 2.74 per cent above the 2012-13 result of 73 per cent and 7.14 per cent above the target of 70 per cent in 2013-14.
The indicator for perceived safety on-board buses reached 84 per cent, 3.70 per cent above the 2012-13 result of 81 per cent and 2.44 per cent above the target of 82 per cent in 2013-14.
During the year, bus services kilometres and patronage increased by 4.19 per cent and 0.20 per cent respectively while the number of security incidents was 26.33 per cent below the 2012-13 result.
Level of notifiable occurrences
Rail Safety
Railway safety incidents are recorded and notified to the Office of Rail Safety. These incidents are termed ‘notifiable occurrences’ and are defined in the Rail Safety Regulations 2011 as Category ‘A’ (serious injury, death, or significant damage) or Category ‘B’ (incidents that may have the potential to cause a serious accident). Notifiable occurrences reporting is a legislated requirement under the Rail Safety Act 2010 for the accredited owner and operator of a rail system and form part of the PTA’s safety management system. These arrangements do not cover bus operations.
The performance measure for Category ‘A’ and ‘B’ occurrences is expressed as the number of occurrences per million passenger boardings and per million train kilometres. A low rate of incidents indicates that sound safety procedures and risk management procedures/controls exist and are operating effectively throughout the rail system.
The benchmark values for Category ‘A’ and Category ‘B’ incidents are calculated on the projected estimations of the number of future passenger boardings and train kilometres.
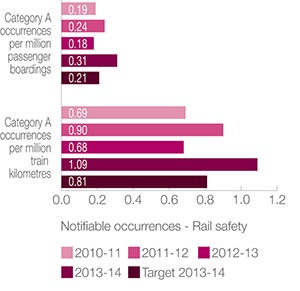
The indicator for Category ‘A’ incidents per million passenger boardings reached 0.31, 72.45 per cent above the 2012-13 result of 0.18 and 49.49 per cent above the target of 0.21 in 2013-14.
The indicator for Category ‘A’ occurrences per million train kilometres reached 1.09, 60.63 per cent above the 2012-13 result of 0.68 and 34.51 per cent above the 2013-14 target of 0.81.
The KPIs were calculated based on 20 Category ‘A’ incidents, total train kilometres of 18.357 million and 63.711 million boardings in 2013-14.
During the year, notifiable occurrences under the “Attempted or Suspected Suicide” category which are beyond PTA’s control increased by 71.43 per cent compared to 2012-13 while passenger boardings decreased by 3.36 per cent and total train kilometres increased by 3.76 per cent.
However, when excluding suicides and attempted suicides, there were 8 Category ‘A’ occurrences in 2013-14 compared to 5 in 2012-13.
Safety Management Systems controls are in place and ongoing reviews undertaken to reduce the incidents.
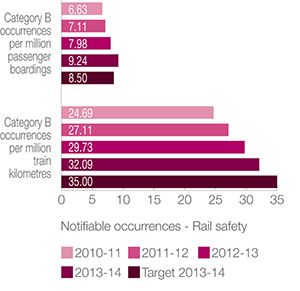
The indicator for Category ‘B’ incidents per million passenger boardings reached 9.24, 15.87 per cent above the 2012-13 result of 7.98 and 8.76 per cent above the target of 8.50 in 2013-14.
The indicator for Category ‘B’ occurrences per million train kilometres reached 32.09, 7.92 per cent above the 2012-13 result of 29.73 and 8.32 per cent below the target of 35 in 2013-14.
There were 589 Category ‘B’ occurrences in 2013-14 compared to 526 in 2012-13, an increase of 11.98 per cent mainly due to increases in vandalism and signal issues while total train kilometres increased by 3.76 per cent and boardings decreased by 3.36 per cent.
Regional school bus services safety
Accidents attributable to all causes are notified to the PTA. The measure for the notifiable occurrences is expressed as the number of accidents (major and minor) reported during the school year.
A low number of occurrences indicate that effective safety management procedures and controls exist and are being adhered to by school bus contractors and drivers throughout the regional school bus fleet.
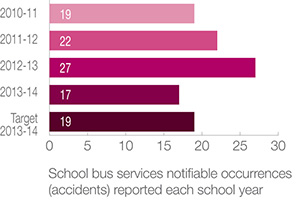
The indicator reached 17, 37.04 per cent below the 2012-13 result of 27 and 10.53 per cent below the target of 19 in 2013-14.
Overall, there were 17 ‘on-road’ school bus accidents in 2013-14, comprising of zero major and 17 minor accidents. Of the 17 accidents, 10 occurred in regional Western Australia and 7 in metropolitan Perth. No fatalities or serious injuries have been recorded.
School Bus Services continues to campaign and educate school bus contractors and drivers on road safety matters and the relative risks associated with accidents. Measures such as the requirement for all contractors to have in place School Bus Contract Safety Management Plan (SMP) and regular random audits of the SMP for compliance are strategic and effective means of improving and maintaining road safety standards. In 2013-14, approximately 88 per cent of the accident cases occurred through no fault of the school bus driver compared to 70 per cent in 2012-13.
Efficiency indicators
The PTA’s effectiveness in providing a cost efficient public transport system is measured using the following key efficiency indicators:
- Average cost per passenger kilometre
- Average cost per 1,000 place kilometres
- Total Passenger place kilometres (millions)
- Average cost per contracted kilometre
Average cost per passenger kilometre
This indicator measures the cost efficiency of providing passenger services, expressed as the cost of carrying one passenger one kilometre.
Transperth
Passenger kilometres are calculated by multiplying the number of total boardings by the average trip length.
The indicator measures the cost efficiency of the services, i.e. the trend in the cost of carrying one passenger over one kilometre. A declining trend indicates that the resources used to provide the services are being utilised in a cost efficient manner.
Transperth train services
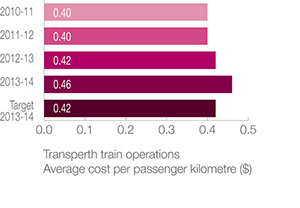
The indicator reached $0.46, 10.96 per cent above the 2012-13 result of $0.42 and 10.40 per cent above the target of $0.42.
This was mainly due to the increase in costs of services compared to the previous year and the shortfall in passenger kilometres caused by the decline in train patronage.
During the year, cost of the services increased by 8.93 per cent to $466.246 million from $428.025 million in 2012-13 and was marginally (0.42 per cent) above the target of $464.3 million. The increased costs were mainly due to a 4.34 per cent increase in service kilometres following the delivery of three new railcars, additional special event services and a new timetable being introduced in July 2013 to accommodate the Perth City Link.
Passenger kilometres decreased by 1.83 per cent to 1,006 million in 2013-14 from 1,024 million in 2012-13 and was 7.96 per cent below the target of 1,093 million in 2013-14. The average trip length on train increased to 18.59 kilometres in 2013-14 from 18.33 kilometres in 2012-13. However, the 3.35 per cent decline in passenger boardings over the 2012-13 resulted in the drop in passenger kilometres.
Transperth bus services
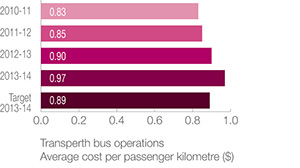
The indicator reached $0.97, 8.13 per cent above the 2012-13 result of $0.90 and 9.37 per cent above the target of $0.89 in 2013-14.
This was mainly due to the increase in costs of services compared to the previous year and the shortfall in passenger kilometres caused by a reduction in average trip length.
In 2013-14, cost of the services increased by 6.11 per cent to $444.610 million from $419.024 million in 2012-13 and was marginally (0.33 per cent) below the target of $446.103 million. This was mainly due to a 4.19 per cent increase in bus service kilometres and a marginal (0.20 per cent) increase in patronage.
Passenger kilometres also decreased by 1.87 per cent to 456.772 million from 465.493 million in 2012-13 and was 9.07 per cent below the target of 502.338 million in 2013-14. The decline in passenger kilometres was due to a 1.97 per cent decrease in average trip length to 5.46 kilometres in 2013-14 from 5.57 kilometres in 2012-13.
Transperth ferry services
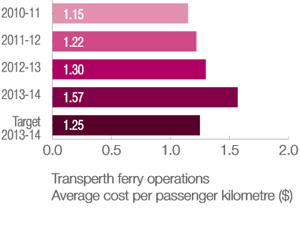
The indicator reached $1.57, 21.05 per cent above the 2012-13 result of $1.30 and 25.88 per cent above the target of $1.25 in 2013-14.
This was mainly due to the increase in costs of services compared to the previous year and the decrease in passenger kilometres caused by the decline in ferry patronage.
Cost of the services increased by 13.33 per cent to $0.944 million from $0.833 million in 2012-13 and was 16.45 per cent above the target of $0.811 million in 2013-14. The increase in costs is mainly due to additional expenditures incurred to relocate the SmartRider wireless network to the new mooring facility due to work on Elizabeth Quay and to modify the ferry’s cabin to facilitate the use of the new manual boarding ramp.
Passenger kilometres decreased by 6.38 per cent to 600,181 from 641,067 in 2012-13 and was 7.24 per cent below the target of 647,000 mainly due to a 6.38 per cent decrease in ferry patronage.
Transwa rail services
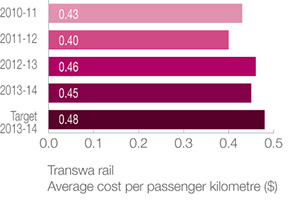
The indicator reached $0.45, 2.58 per cent below the 2012-13 result of $0.46 and 6.70 per cent below the 2013-14 target of $0.48.
This was mainly due to a 8.89 per cent decrease in total expenses to $31.147 million from $34.184 million in 2012-13 following the deferral of heavy maintenance projects and a 6.47 per cent decrease in passenger kilometres from 74.364 million in 2012-13 to 69.550 million in 2013-14.
The reduction in passenger kilometres is largely driven by decreases of 6.90 per cent in Prospector patronage and 5.81 per cent in Australind patronage. In 2013-14, total Rail service kilometres decreased marginally (0.30 per cent) to 0.989 million kilometres from 0.992 million in 2012-13.
Transwa road coach services
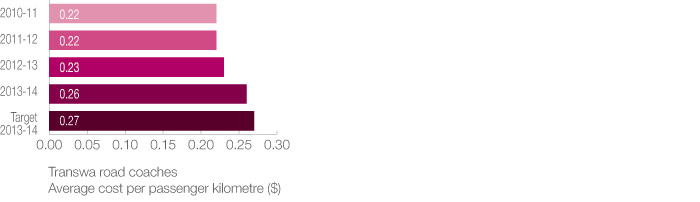
The indicator reached $0.26, 12.61 per cent above the 2012-13 result of $0.23 and 3.40 per cent below the target in 2013-14.
This was mainly due to a 6.37 per cent increase in total expenses to $15.913 million from $14.960 million in 2012-13 associated with unscheduled breakdown repairs and higher preventative maintenance costs and a 5.54 per cent decrease in passenger kilometres from 64.592 million in 2012-13 to 61.011 million in 2013-14 driven mainly by a 5.62 per cent decrease in patronage and a 3.13 per cent decrease in service kilometres.
Average cost per 1000 place kilometres
This indicator measures the cost efficiency of providing the service per 1000 place kilometres and it is calculated for each mode by dividing total cost by place kilometres and multiplying by 1,000. Place kilometres are calculated by multiplying the average fleet capacity by the service kilometres.
Regional bus services
Intra-Town and Inter-Town Services
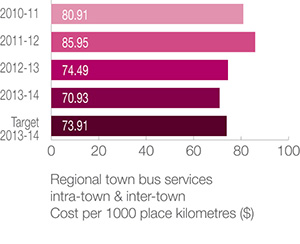
The indicator reached $70.93, 4.78 per cent below the 2012-13 result of $74.49 and 4.04 per cent below the target of $73.91 in 2013-14.
This was mainly due to a 14.34 per cent increase in total passenger place kilometres from 211.040 million in 2012-13 to 241.311 million in 2013-14 (largely due to a 11.31 per cent increase in service kilometres from 3.057 million kilometres in 2012-13 to 3.402 million in 2013-14 and increases in average bus fleet capacity following fleet changes in Bunbury, Geraldton, Albany, Kalgoorlie and Esperance as part of the on-going regional bus fleet replacement program).
During the year, total patronage increased by 1.80 per cent and total costs increased by 8.88 per cent to $17.116 million from $15.720 million in 2012-13.
Total passenger place kilometres (millions)
This indicator measures the total number of passengers that can be carried for the service kilometres. It is calculated for each mode of transport by multiplying the average fleet capacity by the service kilometres and this represents the capacity provided on each mode.
The service kilometres for most intra-town services are calculated using the Transperth Route Information System (TRIS).
Regional bus services
Intra-town and Inter-town Services
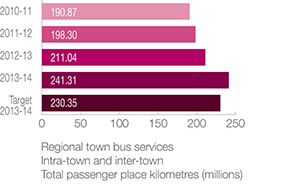
The indicator reached 241.311, 14.34 per cent above the 2012-13 result of 211.040 and 4.76 per cent above the target of 230.346 in 2013-14.
This was mainly due to a 11.31 per cent increase in service kilometres from 3.057 million kilometres in 2012-13 to 3.402 million in 2013-14 and increases in average bus fleet capacity following changes in 2013-14 to bus fleet in Bunbury, Geraldton, Albany, Kalgoorlie and Esperance.
Average cost per contracted kilometre
Regional school bus services
The cost of administering school bus services on a kilometre basis is calculated by dividing the total cost of school bus contracts and operating expenses by the total contracted kilometres.
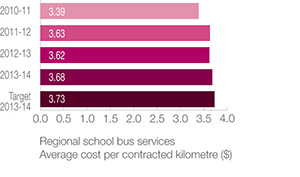
The indicator reached $3.68, 1.49 per cent above the 2012-13 result of $3.62 and 1.39 per cent below the target of $3.73 in 2013-14.
During the year, total costs increased by 5.54 per cent to $120.393 million from $114.074 million in 2012-13 mainly due to the increased costs associated with a 3.99 per cent increase in contracted kilometres to 32.732 million kilometres from 31.476 million in 2012-13 as a result of additional contract service days in 2013-14.
Outcome 2:
Protection of the long-term functionality of the rail corridor and railway infrastructure
Effectiveness indicator
The most significant issue for this outcome is the management of the long-term lease of the rail freight infrastructure to Brookfield Rail Pty Ltd.
Brookfield Rail manages and operates the rail freight infrastructure under the terms of the Railway Infrastructure Lease. Under the Lease, Brookfield Rail is the ‘accredited owner’ of the infrastructure as defined in the Rail Safety Act 1998.
Under the terms and conditions of the Railway Infrastructure Lease, an independent inspection of the railway infrastructure is carried out every five years. The last independent inspection was completed in June 2010.
The results of this inspection did not indicate any cause for concern and confirmed that the rail corridor and infrastructure was being satisfactorily maintained.
Cost efficiency
The cost efficiency for the management of the long-term lease of the rail freight infrastructure to Brookfield Rail is monitored using the total cost of managing the rail corridor and residual freight issues.
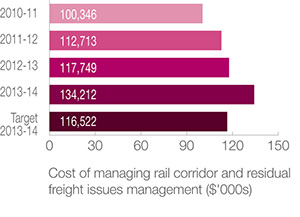
The cost of managing the rail corridor and residual freight issues in 2013-14 was 13.98 per cent above the 2012-13 result and 15.18 per cent above the target.
This was mainly due to a net $13.5 million write-off of non-current assets after completion of the resleepering of the grain freight network and increases in supplies and services costs.