- Home
- Operational Report
- Customers and community
Customers and community
An independent market research organisation is commissioned to undertake annual Passenger Satisfaction Monitors (PSMs) to assess the level of passenger satisfaction with various aspects of Transperth and Transwa services. The survey conducts detailed face-to-face interviews with regular public transport users, covering all the main demographics.
Transperth
The Transperth PSM, which has been running for 21 years, surveyed more than 4250 passengers, covering all modes, all the bus contract areas and all the rail lines.
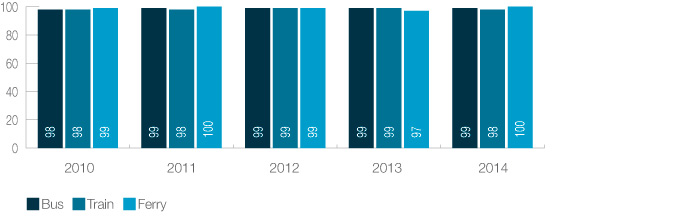
Transperth: Level of overall customer satisfaction (per cent)
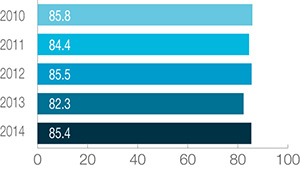
Satisfaction with the quality of service on Transperth bus, train and ferry operations overall (calculated as the weighted average across all modes) recorded a marked improvement in 2014, rising 3.8 per cent (or 3.1 percentage points) from 82.3 to 85.4 per cent. There were good increases across all the modes.
Transperth trains
The proportion of passengers who said they were satisfied with train services rose six per cent (five points) to 89 per cent.
Transperth trains: Level of overall customer satisfaction (per cent)
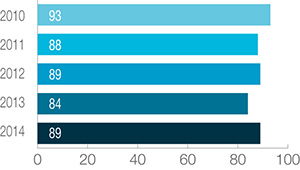
Among peak passengers, 87 per cent expressed satisfaction in 2014, a significant 8.8 per cent increase; among off-peak passengers, it was 91 per cent (88 per cent in 2013). The proportion of passengers who were dissatisfied overall fell sharply to three per cent (previously seven per cent).
The main reasons for dissatisfaction were “too crowded in peak times”, “no seating in peak times”, “need extra carriages/longer trains”. To address this issue, the PTA has ordered 66 new railcars, of which nine were delivered and entered into service during the year. These additional railcars have been used to increase the number of six-car trains in operation.
The importance rating of the key service characteristics of Transperth train services (other than passenger safety) and the respective levels of satisfaction are as follows:
| Service characteristic | Importance rating % | Satisfaction (dissatisfaction) rating % | ||
|---|---|---|---|---|
| 2013 | 2014 | 2013 | 2014 | |
| Cost of fares | 72 | 72 | 52 (16) | 52 (16) |
| Speed of the trip | 63 | 66 | 92 (2) | 93 (2) |
| Punctuality | 69 | 63 | 93 (3) | 95 (1) |
| Availability of seats | 62 | 56 | 72 (18) | 73 (17) |
| Cleanliness on board | 57 | 48 | 90 (2) | 90 (3) |
| Service frequency weekdays | 57 | 48 | 82 (8) | 83 (6) |
| Service frequency peak times | 54 | 43 | 74 (16) | 82 (11) |
| Time waiting for connecting bus | 36 | 36 | 68 (16) | 72 (15) |
In 2014, as in 2013, most respondents rated “cost of fares” the most important service characteristic. The satisfaction levels were also unchanged.
In regard to the other service characteristics, the proportion of users who were satisfied remained high or increased in some cases. The most significant improvement was in “service frequency peak times” where the satisfaction rating rose to 82 per cent (74 per cent previously) and dissatisfaction fell from 16 to 11 per cent.
Transperth buses
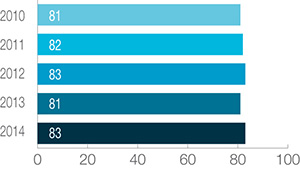
The proportion of bus users who reported being satisfied overall with the system increased 2.5 per cent (two points) to 83 per cent. At eight per cent (previously nine), the dissatisfaction rating was the lowest in the 19 years since bus services have been contracted out. The main reasons cited for dissatisfaction were “infrequent services”, “buses never on time” and “insufficient off-peak services.”
Transperth buses: Level of overall customer satisfaction (per cent)
The importance rating of the key service characteristics of Transperth bus services (other than passenger safety) and the respective levels of satisfaction are as follows:
| Service characteristic | Importance rating % | Satisfaction (dissatisfaction) rating % | ||
|---|---|---|---|---|
| 2013 | 2014 | 2013 | 2014 | |
| Punctuality | 72 | 70 | 82 (9) | 76 (13) |
| Cost of fares | 71 | 58 | 58 (13) | 56 (13) |
| Service frequency weekdays | 58 | 54 | 68 (19) | 71 (18) |
| Shelter provided at the bus stop | 61 | 53 | 74 (18) | 74 (17) |
| Availability of seats | 51 | 45 | 92 (5) | 92 (4) |
| Speed of the trip | 54 | 43 | 92 (3) | 89 (4) |
| Cleanliness on board | 52 | 43 | 93 (2) | 94 (1) |
| Service frequency peak times | 43 | 41 | 73 (19) | 79 (13) |
The proportion of respondents who said they were satisfied with our performance in the two top-rated characteristics, “punctuality” and “cost of fares”, fell slightly.
Transperth ferries
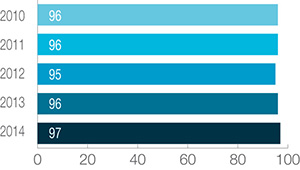
A very high proportion of passengers were happy with the ferry service overall, continuing a well-established trend. In 2014, 97 per cent of respondents expressed satisfaction – the highest level since 2010. The dissatisfaction rate remained at zero for the third year in succession.
Transperth ferries: Level of overall customer satisfaction (per cent)
The importance rating of key service characteristics (other than passenger safety) and the respective levels of satisfaction are as follows:
| Service characteristic | Importance rating % | Satisfaction (dissatisfaction) rating % | ||
|---|---|---|---|---|
| 2013 | 2014 | 2013 | 2014 | |
| Cleanliness on board | 76 | 75 | 100 (0) | 100 (0) |
| Cost of the fare | 78 | 73 | 78 (2) | 82 (2) |
| Punctuality | 66 | 64 | 91 (1) | 99 (0) |
| Service frequency weekdays | 60 | 58 | 70 (13) | 71 (18) |
| Speed of the trip | 58 | 55 | 97 (1) | 99 (0) |
| Availability of seats | 53 | 53 | 87 (13) | 100 (0) |
| Shelter at the jetty | 48 | 48 | 74 (18) | 83 (12) |
| Service frequency peak times | 46 | 93 (3) | ||
| Access to ticket purchase facilities | 43 | 83 (17) | ||
Ferry passengers expressed high-level satisfaction with all aspects except “service frequency weekdays,” where the proportion satisfied increased slightly to 71 per cent. There were good increases in several other areas.
Transwa
The Transwa PSM has been running for 12 years and surveyed 1244 passengers, covering road coach operations as well as all the rail services. Overall customer remained very high level, with 90 per cent of passengers either satisfied or very satisfied.
Transwa: Customer satisfaction (per cent)
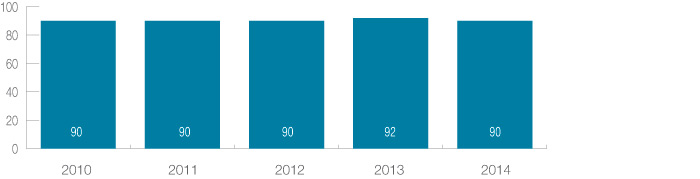
- 90% Transwa passenger satisfaction
- 610 bus stops upgraded to disability standard
Transwa trains
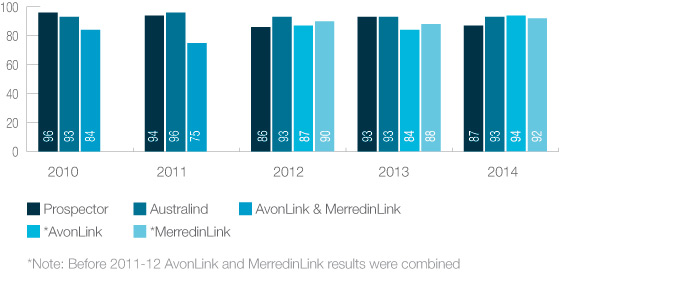
There were excellent satisfaction levels for our trains – the AvonLink and MerredinLink ratings jumped significantly to 94 (previously 84) per cent and 92 (88) per cent respectively and the Australind remained high at 93 per cent but Prospector approvals fell to 87 (93) per cent.
Transwa trains: Customer satisfaction (per cent)
Transwa road coaches
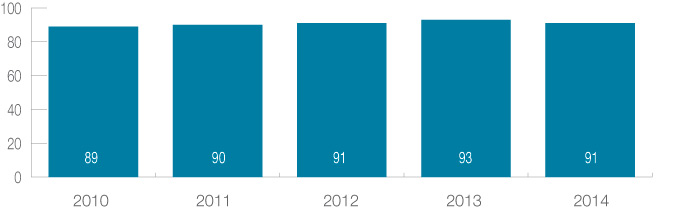
The road coaches also enjoy a consistently high satisfaction level, with 91 per cent of customers happy with our road coach services.
Transwa road coaches: Customer satisfaction (per cent)
Customer safety and security
The PSM assesses customer perceptions of safety during the day and at night, waiting for and aboard the (bus/train/ferry) service. Across the modes, virtually all passengers feel safe (aboard or waiting) during the day.
Transperth: Passenger safety (per cent)
Proportion of respondents who generally feel safe on-board during the day.
Transperth trains
The 2014 PSM asked train users: Thinking about the issue of personal safety whilst using the service, that is how safe you feel from personal interference or threat from other passengers, how safe do you generally feel?
The following chart shows the proportion of respondents who “always or usually feel safe” on the train system.
Transperth trains: Customer perception of safety (per cent)
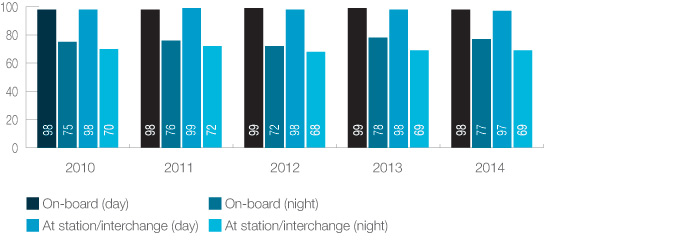
The proportion of users who said they felt safe on board at night fell slightly to 77 per cent (from 78), while the proportion feeling safe at the station/interchange was unchanged at 69 per cent.
The PTA is committed to ensuring that all passengers feel safe at all times on the train network. To help achieve this aim, digitised CCTV footage from all train stations is monitored at the CMR, a state-of-the-art facility which is manned 24 hours a day, seven days a week. Other safety features include high-level lighting at stations, duress buttons at platforms and on all railcars, and transit officers on trains, at stations and in mobile patrols.
Transperth buses
Bus users were also asked: Thinking about the issue of personal safety whilst using the service, that is how safe you feel from personal interference or threat from other passengers, how safe do you generally feel?
The following chart shows the proportion of respondents who “always or usually feel safe” on the bus network.
Transperth buses: Customer perception of safety (per cent)
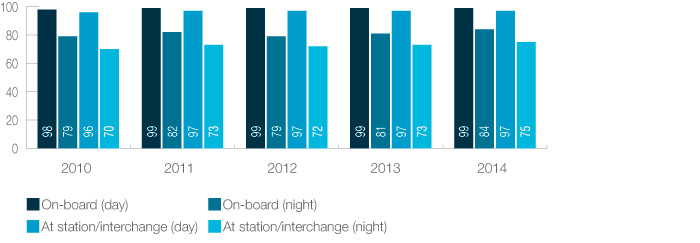
While the daytime safety perceptions were steady, the night-time figures both showed an improvement, reaching 84 per cent (on-board) and 75 per cent (waiting) – the best they have been for five years.
This reflects the big investment Transperth has made in passenger security. As is the case with trains, all major bus stations have CCTV cameras which feed into the CMR. A fleet of 18 patrol cars manned by Wilson Security officers backs this up with a rapid response to any on-road antisocial behaviour incidents.
Transperth ferries
Again, ferry passengers were asked: Thinking about the issue of personal safety whilst using the service, that is how safe you feel from personal interference or threat from other passengers, how safe do you generally feel?
The following chart shows the proportion of respondents who “always or usually feel safe” on the ferry service.
Transperth ferries: Customer perception of safety (per cent)
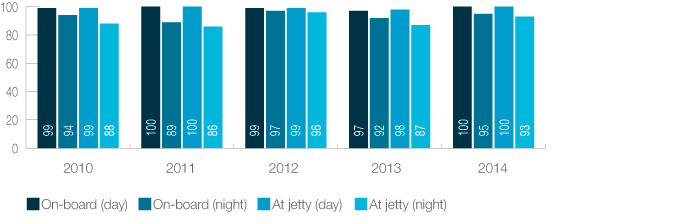
As was the case with buses, there was a significant increase in the proportion of users who felt safe at night, both on board and waiting at the jetty.
Transwa
Transwa continued to provide a very safe service for customers through its commitment to safety systems, procedures and processes. The number of passenger injuries during the year remained very low.
Safety audits
Transperth buses
Safety audits and monitoring of Transperth bus contractors continued in line with standard AS4801-OSH Management Systems. Each depot was audited at least once, with other documented site visits throughout the year. These regular audits and inspections have generated improved safety management systems and safety focus, and our contractors’ LTI rate continues to be well below the industry standard.
- Swan Transit was re-certified to AS4801 in August 2012 and is current until August 2015. It is also certified as compliant with ISO 14001 Environmental Management Systems, valid to February 2015. In 2013-14, Swan’s LTI frequency rate was 10.0 and the LTI incident rate was 1.8.
- Path Transit was re-certified to AS4801 in November 2013 and is current until August 2015. It is also certified as compliant with ISO14001 Environmental Management Systems, valid to August 2015. In 2013-14, Path’s LTI frequency rate was 14.8 and the LTI incident rate was 2.5.
- Transdev was re-certified to AS4801 in January 2014 and is current until January 2017. It is also certified compliant with ISO 14001 Environmental Management Systems, valid to January 2017. In 2013- 14, Transdev’s LTI frequency rate was 2.29 and the LTI incident rate was 0.4.
School Bus Service
In 2013-14, SBS completed a number of safety programs.
- Introduced the Safety Management System (SMS), made up of a safety management plan, driver’s operating guide and an emergency plan. It included an example of a compliant policy, as well as guidelines and forms to enable contractors and drivers at all levels of experience to implement safe systems of work.
- The plan was rolled out over a series of workshops in the various regions. In addition to the presentation, contractors were provided with a hardcopy version and website access to the SMS.
- New contracts with SBS require compliance with the SMS as a KPI. The audit process and reporting chain for escalating issues is nearing completion and safety plan auditing is expected to start in the first quarter of 2014-15.
- Following an eight-week trial, ministerial approval was given for the installation of child-check safety devices on new school buses. The safety device is activated by the driver who must walk to the rear of the bus where the device is located and ensure that no child remains on the bus.
- Since July 1, 2013 all new buses must have a child-check alarm.
- A project to install engine fire suppression systems on all existing education support buses which carry special needs children is due for completion in August 2014. All new ed- support buses must have these systems.
Since July 1, 2013 all new buses must have a child-check alarm
Accessing our services
About 85 per cent of Perth homes have access to public transport. This metric – which has been steady for three years – reflects the proportion of Property Street Addresses (PSAs) in the Perth Public Transport Area (PPTA) that are within walking distance (500m) of a Transperth stop or station providing an Acceptable Service Level (ASL). An ASL is defined as a 20-minute or better service in the peak-flow direction during the peak, and at least an hourly service throughout the core of the day.
Transperth uses GPS data to determine the exact location of all bus stops and train stations. Access to these facilities is measured against other spatial and scheduling data – in this case PSAs and service timetables.
Access to public transport (per cent)
This refers to the proportion of property street addresses in the Perth Public Transport Area within 500m of a Transperth stop or station providing an acceptable service level.
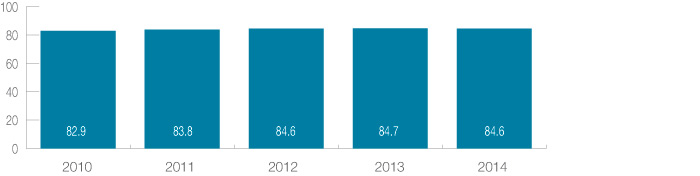
There were 783,270 PSAs within 500m of an ASL stop/station in 2014, up one per cent from 775,253 in 2013 and 9.4 per cent more than the 715,719 PSAs reported in 2010.
Disability access
Transperth aims to provide universal access to all its services for the wider community – including the elderly, people with disabilities, and parents with prams.
Disability Access and Inclusion Plan
The PTA continued to improve access to public transport for people with a disability, working through the 2012-17 DAIP, which was released in July 2012.
Achievements included:
- Audited our train stations and infrastructure to determine the level of compliance with the Disability Standards for Accessible Public Transport (DSAPT) 2002.
- Continued implementation of a 12-year program to progressively replace the existing fleet with new, low-floor, accessible buses – at June 30, 86.8 per cent of our metro-area fleet (1164 of 1340 buses) and 68.7 per cent of our regional buses (90 of 131) were accessible.
- Progressively increasing the number of accessible bus services. Preference is given to operating accessible buses whenever possible so that, off-peak, most buses are accessible. In the peak, accessible and non-accessible buses are fully committed.
- Continued recognition of companion cards to allow a companion to travel with a person with a permanent disability at no additional cost.
- Developing and managing accessibility groups via My Alert emails (formerly TravelEasy) as a mechanism to disseminate disability-specific updates to relevant organisations. During the year, 14 accessibility bulletins were distributed via email to 10,085 customers registered with Transperth Accessible Services to advise of system changes, upgrades and other Transperth news relating to accessibility issues.
- Completed the upgrades of Queens Park, Beckenham and Maddington stations. Upgrading 610 bus stops to meet DSAPT requirements under the Government’s Bus Stop Accessibility Works – 2706 upgrades have been completed since 2010.
- The PTA assisted the Department of Transport (WA) and Department of Infrastructure and Transport (Federal) in gathering data to support Recommendation 1 of the 2012 DSAPT review.
- People who hold a carers’ health care card and receive the Commonwealth carer payment can now travel free between 9am and 3.30pm on weekdays and all day on weekends and public holidays.
- Conducted three on-site accessibility sessions at Perth Station for the disability sector as part of the Perth City Link project. More than 6500 bulletins were sent and 240 disability organisations targeted.
- Delivered 56 presentations and station tours through the school-based Get On Board program for education support students.
- The Transperth Education team continued to work closely with disability organisations to deliver information and training at both the staff and client level. Transperth Education participated with the disability sector in the Abilities Expo, Homeless Connect (Perth and Victoria Park) and CarersWA forums; and worked with Activ, Goodwill Engineering, PEP Community Services, Therapy Focus, TAFE, Red Cross, ASeTTS and Communicare on-site and at stations to equip staff and clients with the skills and knowledge to be safe and confident travellers.
- Eighteen seniors accessibility programs were delivered across local government and community organisations.
- Translating and Interpreting Service (TIS) - call count for InfoCentres and the CallCentre was 173 (July 2013 – May 2014).
The environment
The PTA continues to work to identify opportunities to maximise sustainability during the development and planning of transport services. In the latest year this included:
- Commissioning consultants to develop a Sustainability Framework for the Forrestfield-Airport Link Project.
- Integration of infrastructure for pedestrians and cyclists.
- Protection and restoration of local air, water, soils, flora and fauna.
- Services to improve accessibility for people with disabilities.
We continued with:
- The PTA water efficiency management plan.
- Using reverse osmosis on recycled water to wash railcars.
- Our Energy Efficiency Opportunities Program, including completing energy assessments of the Public Transport Centre and Transperth’s trains.
We also:
- Submitted our Greenhouse and Energy Report to the Department of Climate Change.
- Audited our contractor, Downer Bombardier, to ensure environmental compliance at our Claisebrook, Nowergup and Mandurah train depots.
- Completed and implemented our Environmental Management Systems (EMS) manual to support the PTA in achieving legal compliance, controlling risks for operations and capital works, and encouraging continuous improvement in environmental performance.
Communicating with our customers
In 2013-14, the Transperth Information and Event Services team successfully undertook a wide range of initiatives:
- Successfully promoted the launch of the new route 950 Superbus service from Morley Bus Station to QE11 Medical Centre and UWA.
- Coordinated the delivery of train replacement services during the two major train service shutdowns in connection with the work for the Perth City Link project; and delivered information to passengers regarding the disruptions and replacement services provided.
- Launched a campaign to educate passengers about the introduction of paid parking and installed new signage relating to the paid parking initiative at train station car parks.
- Continued to provide service disruption information to passengers across all modes. Planned major disruptions included moving bus services from Barrack Street to William Street, the closure of the Wellington Street Bus Station and the opening of the temporary Roe Street bus station, as well as continuing infrastructure maintenance.
- Delivered service change information to passengers following the continued roll- out of additional bus service kilometres under the bus service expansion program.
- Continued to deliver Get on Board presentations to a broad range of community groups. Work continued on an online portal aimed at educating primary school students about public transport.
- Launched the new Transperth website to ensure it continued to meet the needs of passengers. This upgrade made the website device-responsive, allowing passengers to use it regardless of which device they use to visit the site – mobile phone, computer or tablet.
- Launched the new Transperth App on both Android and iOS platforms. This allowed passengers to use their mobile phones to plan journeys, check SmartRider balances, as well as find the next service departing from any stop, station or jetty.
- Continued to work with major event organisers to ensure the provision of public transport for special events and promote integrated ticketing.