Measuring Performance
Outcome 1: Accessible, reliable and safe public transport system
EFFECTIVENESS INDICATORS
The PTA’s effectiveness in providing an accessible, reliable and safe public transport system is measured using the following key effectiveness indicators for:
- Use of public transport
- Accessible public transport
- Service reliability
- Level of overall customer satisfaction
- Customer perception of safety
- Level of notifiable safety incidents
1. Use of public transport
The use of public transport is measured by comparing the annual number of passengers carried with the number of service kilometres. Service kilometres are kilometres operated on scheduled passenger services and exclude “non-productive running” i.e. travelling from the depot to commence a service trip, and travelling back after completing a service trip.
The measure indicates the extent to which services provided, as represented by the number of kilometres operated, are being utilised. An increasing trend in the indicator will generally signify that patronage is rising at a rate greater than the rate of increase in service kilometres operated and represents an improvement in effectiveness as well as an increase in the use of public transport.
This effectiveness indicator is applied to each mode of public transport. The indicator is based on total boardings on Transperth services and includes fare-paying boardings plus free travel and transfers. Transfers are boardings which occur either between services within the same mode or between modes during the specified free transfer time.
Transperth bus services
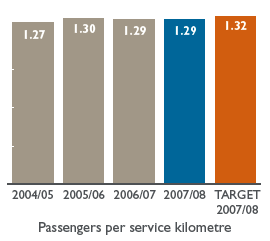
The result for 2007/08 remained unchanged compared to 2006/07 but was 2.3% below the target for the year. Total boardings on bus increased by 1.7% from 64.623 million in 2006/07 to 65.694 million, while service kilometres rose by 1.9% from 49.961 million to 50.923 million. The 2007/08 target of 1.32 was based on projected total boardings of 67.541 million and projected service kilometres of 51.0 million on the assumption that operations on the Mandurah Line would commence in August 2007. The Mandurah Line started operations in December 2007.
Transperth train services
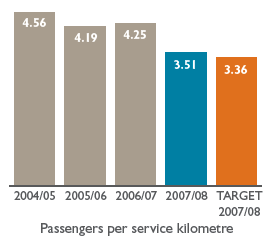
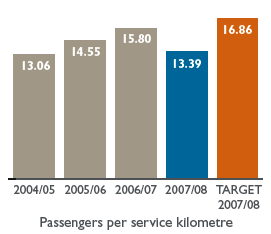
The 2007/08 result showed a decline in passengers per service kilometre compared to 2006/07 but was above the target.
Total boardings on train recorded an increase of 19.2% in 2007/08, from 35.758 million in 2006/07 to 42.636 million, reflecting the significant impact of the Mandurah Line on train patronage, while service kilometres increased by 44.4%, from 8.408 million to 12.138 million. As a result, passengers per service kilometre fell 17.4% in 2007/08 compared to 2006/07.
Compared to target, passengers per service kilometre showed an increase of 4.5% in 2007/08 due to a 17.7% reduction in projected service kilometres. The target was based on projected total boardings of 49.546 million and 14.741 million service kilometres on the assumption that the Mandurah Line would start operations in August 2007. The Mandurah Line started operations in December 2007.
Regional town bus services
In order to provide a more meaningful result in reporting the performance of regional town bus services, the effectiveness indicator for passengers per service kilometre has been separated into intra-town and inter-town components.
Intra-town services operate within rural town boundaries, while inter-town services run between regional centres.
a. Intra-town bus services
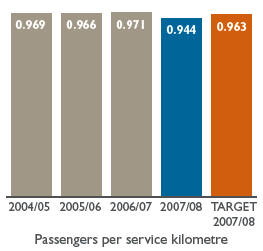
For regional intra-town services, the result for 2007/08 was below the target for the year and when compared to the previous years, there was a decrease in passengers per service kilometre.
The decrease in passengers was particularly significant on the Port Hedland and Kalgoorlie services.
On the Port Hedland service the drop in passengers was due to the implementation of the PTA’s policy, requiring students who reside within the defined Public Transport Area of a regional town to pay a fare for using public transport. Previously due to an anomaly many students in Port Hedland were travelling free of charge.
On the Kalgoorlie service, the decrease was probably due to the change over from a manual to an electronic ticketing system in 2007/08, resulting in more accurate figures for passengers.
b. Inter-town bus services
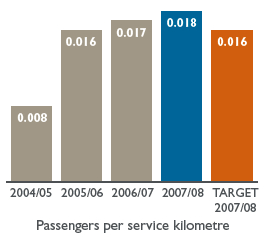
The 2007/08 result was above target and better than the previous years’ performance as a result of the inclusion of the subsidised service between Kalgoorlie and Laverton from 1 October 2007.
Transperth ferry services
Passengers per service kilometre declined in 2007/08 compared to 2006/07 and was below target.
Total boardings on ferry fell 15% in 2007/08 to 463,673 from 545,357 in 2006/07, while service kilometres increased marginally from 34,519 to 34,641, resulting in a 15.3% decline in passengers per service kilometre from the previous year.
The 2007/08 result was 20.6% below target. The target was based on 590,000 total boardings and 35,000 service kilometres. In setting the target, it was assumed that the significant increase in ferry patronage in 2005/06 and in 2006/07 would be sustained.
Transwa rail services
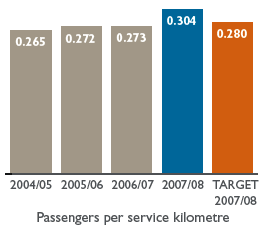
Despite a decrease in patronage, passengers per service kilometre in 2007/08 increased by 8.6% against the target for the year. That was due to the partial replacement of Prospector services with road coaches due to track works on the Eastern Goldfields Line, resulting in lower service kilometres.
Transwa road coach services
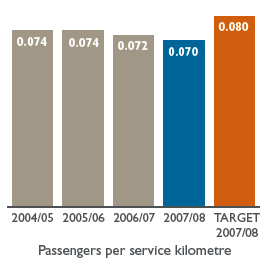
The 2007/08 result was below target and slightly below 2006/07. Road Coach patronage has fallen 9% below target, contributing in passengers per service kilometres to fall 12.5% against target.
2. Accessible public transport
Accessibility to public transport, in terms of service coverage, is measured as the proportion of Property Street Addresses (PSAs) within the Perth Public Transport Area (PPTA) which are within 500 metres of a Transperth stop providing an acceptable level of service. The PPTA defines the core operational areas for Transperth services.
“Acceptable service level” (ASL) is defined as an hourly service during the day with at least three trips per hour (i.e. at 20-minute intervals) in the peak flow direction in the morning and/or afternoon peaks, excluding dedicated school bus services.
The indicator uses PSA data from Landgate and service information and stop location data from the Transperth Route Information System (TRIS).
The measure demonstrates the extent to which the PTA meets its accessibility standards in the Perth metropolitan area.
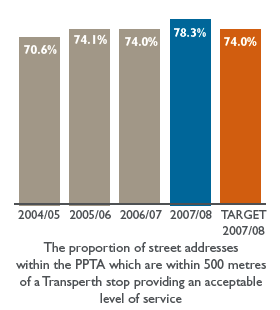
The 2007/08 result demonstrated that the PTA exceeded its accessibility target in the Perth metropolitan area.
The proportion of Property Street Addresses (PSAs) within 500 metres of an ASL stop increased by 5.8% in 2007/08 compared to 2006/07. The improvement was due mainly to the introduction of the Mandurah Line which resulted in a 9% increase in the number of Transperth stops, from 11,852 in May 2007 to 12,882 in May 2008, and in 12% increase in the number of ASL stops, from 5,969 to 6,698. More of Perth’s population is now within accessible distance of a public transport stop/station with a good service level.
3. Service reliability
According to an independent survey which measured customer satisfaction, service reliability is regarded as one of the most significant characteristics of a quality service. Service reliability is essentially a combination of two main factors, punctuality and consistency. Services are considered to be punctual if they arrive within a defined period of time after the scheduled arrival time. This parameter is referred to as ‘on-time arrival’ and is shown in the table for each operation.
| OPERATION | ‘ON-TIME ARRIVAL’ PARAMETER |
|---|---|
| Metropolitan and Regional Passenger Services | |
| Transperth Trains | 4 minutes* |
| Transperth Buses | 4 minutes |
| Transperth Ferries | 3 minutes |
| Country Passenger Rail and Road Coach Services | |
| Transwa Rail | |
| Prospector | 15 minutes |
| Australind | 10 minutes |
| AvonLink | 10 minutes |
| MerredinLink | 10 minutes |
| Road Coaches | 10 minutes |
| Regional school bus services | |
| Regional school bus services | Drop off no less than 10 minutes before school starts and pick up within 10 minutes of school ending |
* The ‘on-time arrival’ parameter for Transperth Train has been changed to less than four minutes in 2007/08 as against less than three minutes in 2006/07 and the previous years due to changes to methodology and to ensure consistency across Transperth operations and other Australian rail operators.
The ‘on-time arrival’ measure demonstrates the extent to which the PTA meets its service reliability standards.
Transperth train services
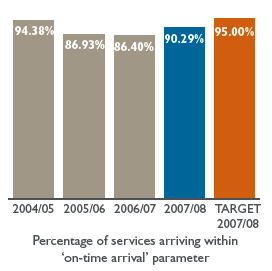
The 2007/08 result was below target because of on-time running delays for the metropolitan train services as a result of:
- Heavy passenger loadings and increased dwell times at stations;
- System faults and failures;
- Drivers undergoing training and the impacts of the Mandurah Line;
- Weather; and
- Railcar faults and failures.
Transperth bus services
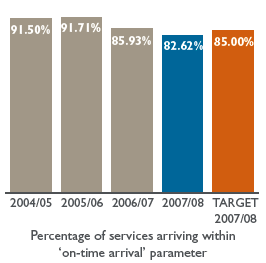
The 2007/08 result was below both the target for the year and the 2006/07 result. During 2007/08, Transperth used the highly accurate “GPS Reporter” functionality of the SmartRider system to monitor bus on-time running for the full year. In 2006/07 when the “GPS Reporter” functionality was used during the second six-month period of the year, average on-time performance was 81.5%. The 2007/08 result (82.6%) showed a marginal improvement in the on-time performance of the Transperth bus operation.
The 2007/08 was below target despite timetabled running times being extended as required to deal with the impact of traffic congestion on bus service reliability. However this proved to be a constant catch-up process and the bus system is bearing an increased impact and cost from congestion.
Transperth ferry services
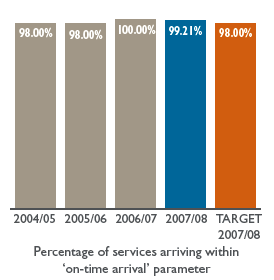
The 2007/08 result was above target but marginally below the 2006/07 result. During 2007/08, Transperth used the highly accurate “GPS Reporter” functionality of the SmartRider system to monitor on-time running on the ferry service.
Transwa rail services
Indicators of the ‘on-time arrival’ performance for Transwa rail services are reported separately for each service.
a. Prospector
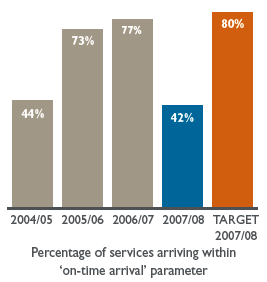
The on-time performance for 2007/08 was significantly below target as a result of major disruptions in services due to track works on the Eastern Goldfields Railway (re-sleepering and construction of new crossing loops) which commenced in October 2007 and continued throughout 2007/08.
b. Australind
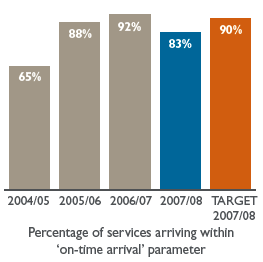
The on-time performance for 2007/08 was below target as a result of speed restrictions applied to track sections with wooden sleepers.
c. AvonLink
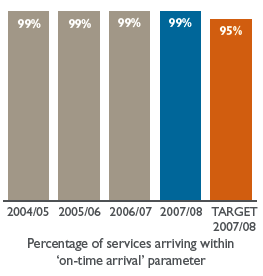
The 2007/08 result was slightly higher than target. The on-time performance of the AvonLink continued at high levels for 2007/08.
d. MerredinLink
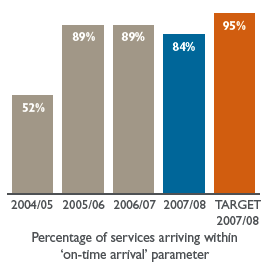
The 2007/08 result was below target as a result of delays caused by late running Prospector services.
Transwa road coach services
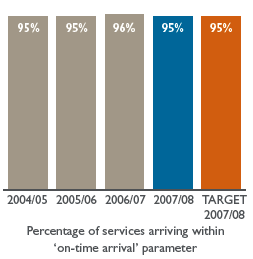
The 2007/08 result was in line with target. Transwa road coach services on-time running was consistent over previous years.
Regional school bus services
This effectiveness indicator measures school bus timetable reliability for rural mainstream services and Special Education School buses operating in the metropolitan area. The on-time arrival parameter is to arrive at school no less than 10 minutes before school starts and departing within 10 minutes of school ending.
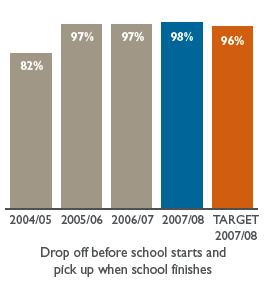
The variance between the 2007/08 result and target showed improvements in on-time arrivals. 1,046 Mainstream and Education Support services were observed of which 1,022 were compliant.
This effectiveness indicator is calculated using a random sample which ties in with the School Bus Service inspection program.
The result for 2007/08 was above target.
| Year | Number of observations for compliance with ‘on-time’ arrival | Observations that were compliant |
|---|---|---|
|
2004/05 |
517 |
452 |
|
2005/06 |
1,188 |
1,156 |
|
2006/07 |
1,086 |
1,048 |
|
2007/08 |
1,046 |
1,022 |
The sample error rate of 3.02% was within + or – 5%, the acceptable tolerance level.
The improvements were related to clearer standards in new contracts and stronger compliance.
4. Level of overall customer satisfaction
The percentage of patrons who, overall, were satisfied with the services measures the public perception of the organisation’s performance in providing a high-quality and attractive public transport service.
The measure for Transperth services is derived from an extensive annual survey conducted by independent pollsters. The survey, known as the ‘Passenger Satisfaction Monitor’ (PSM), provides an objective, unbiased view over time of patrons’ overall satisfaction with the system, e.g. safety, on-time running, courtesy of staff, service frequency and station amenities. The information is used by Transperth to develop strategies for improving service performance and infrastructure.
The pollsters interview a large sample of passengers. Interviewers are assigned to various services and transit station locations over a four week period covering the working week and weekend. This is the most comprehensive public transport survey of passengers in Australia.
Transperth train services
For the rail PSM, a total of 1,001 rail patrons were surveyed, that is, an additional of 200 interviews with patrons using the new Mandurah Line compared to 2006/07. The overall sample comprised of:
- Adults aged 18 years or over resident within the Perth Metropolitan area;
- Current users of Transperth train services (excluding school students); and
- Patrons who travel on trains at least once per fortnight.
The sample error estimates were within + or - 5% at the 95% confidence level.
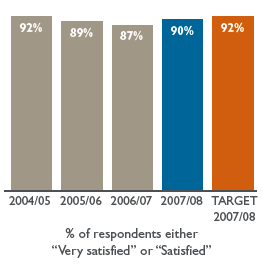
The results for 2007/08 showed an increase in overall satisfaction from 87% to 90% as compared to 2006/07, with very high levels of satisfaction recorded on the Mandurah Line. The target of 92% was not achieved due to overcrowded trains and issues relating to service reliability and on-time running.
The expressed levels of dissatisfaction remained relatively low with the main reasons related mostly to overcrowding of trains during peak periods and trains not running on time.
Transperth bus services
For the Transperth bus PSM, a total of 3,054 bus patrons were surveyed. The overall sample comprised of:
- Adults aged 18 years or over resident within the Perth Bus Contract region;
- Current users of Transperth bus services (excluding school students); and
- Patrons who travel on bus at least once per fortnight.
The sample error estimates were within + or - 2 to 3% at the 95% confidence level.
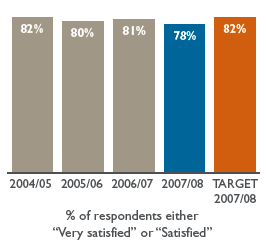
The 2007/08 result was below both the target and the 2006/07 result.
Amongst the 12% of respondents expressing dissatisfaction overall the main issues related to service frequency and punctuality, with 35% dissatisfied because of infrequent buses (35% in 2006/07) and 27% dissatisfied because of no buses/poor service outside normal times (compared to 25% in 2006/07).
One contract area, Morley, recorded a significant lower level of satisfaction (67% in 2007/08 compared to 70% in 2006/07) and a significantly higher level of dissatisfaction (28% as compared to 25%) which contributed to the overall average result.
Transperth ferry services
For the ferry PSM, a total of 201 ferry patrons were surveyed. The overall sample comprised of:
- Adults aged 18 years or over resident within the Perth Metropolitan area; and
- Patrons who were users of Transperth Ferry services and used it more than once a fortnight for Perth residents and whilst visiting for non-resident visitors to Perth. School students were excluded from the sample.
The sample error estimates were within + or -10% at the 95% confidence level.
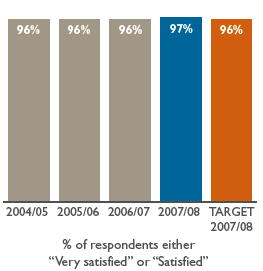
The 2007/08 results showed that overall satisfaction remains high at 97% with a small increase of 1% over each of the previous three years 2004/05 to 2006/07.
Transwa train and road coach services
An independent passenger satisfaction survey is undertaken annually for each service: Australind, Prospector, AvonLink, MerredinLink and Road Coaches.
In 2007/08, a total of 970 country services patrons were surveyed via a self-completion questionnaire.
The sample error estimates were within + or – 3 to 5% at the 95% confidence level.
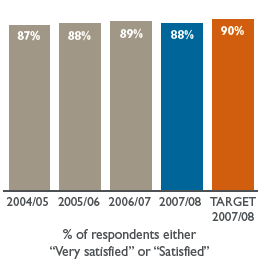
In 2007/08, overall satisfaction with country passenger services decreased slightly to 88%, compared to 89% in 2006/07, with 42% of passengers indicating they were very satisfied and 46% satisfied.
5. Customer perception of safety
Safety perceptions are an important factor in the public deciding whether to use public transport. The PTA is continuing to invest capital funds in security-related infrastructure and has increased its security staff to ensure that customers can see the tangible measures being taken to increase their safety.
Customer perceptions of safety are measured through data gathered in the Passenger Satisfaction Monitor (PSM) which distinguishes between on-train and on-bus and at stations, at night and during the day for the Transperth train and bus services.
Transperth train services
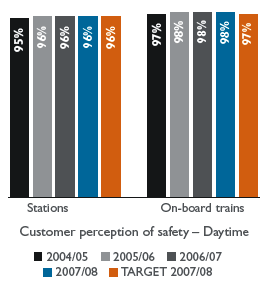
The results for 2007/08 showed that the daytime passenger perception of safety at stations and on-board trains remained very high at 96% and 98% respectively and the results were close to targets. The customers’ perception of safety had remained constant with the two previous years 2005/06 and 2006/07.
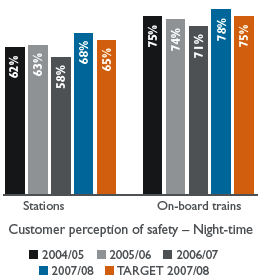
The stations and on-board trains at night time results for 2007/08 PSM were higher and represented significant increase from 2006/07 and the previous years.
The 2007/08 PSM reported that 67% of respondents perceived security to have improved, with 24% ‘very much’ and 43% ‘to some extent’; a result almost identical to the 2006/07 result and a high proportion of rail patrons, acknowledged that Transperth was perceived to be at least ‘doing something’ to address security concerns.
Transperth bus services
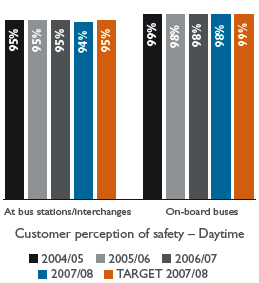
The 2007/08 result was marginally below the targets for both bus stations/interchanges and on-board buses.
The 2007/08 PSM showed that 98% and 94% of respondents ‘always or usually feel safe’ on-board and at bus stations/interchanges during daytime. The results were slightly below the targets of 95% and 99% respectively.
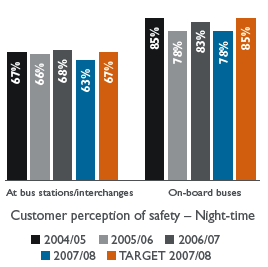
The 2007/08 night-time result for bus stations/interchanges was below target. 63% of respondents indicated they ‘always or usually feel safe’ at that time compared to 68% in 2006/07. Furthermore in 2007/08, 34% of the respondents indicated that they ‘don’t feel very safe’ at that time compared to 30% in 2006/07.
The proportion of respondents who ‘always or usually feel safe’ on-board buses at night-time fell from 83% in 2006/07 to 78% in 2007/08.
Violence on the bus system is unfortunately an increasing event. The marked increase in passengers’ concern with safety reflects their observation and/or perception of increased anti-social behaviour at bus stations and on-board buses.
6. Level of notifiable occurrences
Rail safety
Railway safety incidents are recorded and notified to the Office of Rail Safety. These incidents are termed ‘notifiable occurrences’ and are defined in the Rail Safety Regulations 1999 as Category ‘A’ (serious injury, death, or significant damage) or Category ‘B’ (incidents that may have the potential to cause a serious accident) and Australian Standard “Railway Safety Management” 4292 - 2006. Notifiable occurrences reporting is a legislated requirement under the Rail Safety Act 1998 for the accredited owner and operator of a rail system and therefore form part of the PTA’s safety management system. These arrangements do not cover bus operations.
The performance measure for Category ‘A’ and ‘B’ occurrences is expressed as the number of occurrences per million passenger boardings and per million train kilometres. A low rate of incidents indicates that sound safety procedures and risk management procedures/controls exist and are operating effectively throughout the rail system.
The benchmark values for Category ‘A’ and Category ‘B’ incidents are calculated on the projected estimations of the number of future passenger boardings and train kilometres.
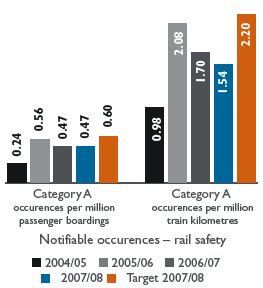
Category ‘A’ incidents per million passenger boardings and per million train kilometres were comparable to 2006/07.
There were 20 Category ‘A’ notifiable incidents for the year 2007/08 compared to 16 in 2006/07, with suicides included. However when excluding suicides and attempted suicides, there were only 4 Category ‘A’ notifiable incidents as compared to 10 in 2006/07.
There were 419 Category ‘B’ notifiable incidents for the year 2007/08 compared to 627 in 2006/07. That showed a significant reduction in notifiable occurrences before taking into account the increased passenger kilometres.
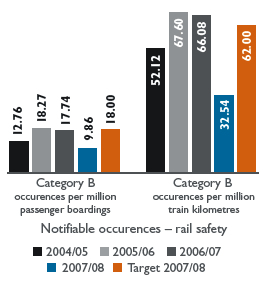
The Category ‘B’ incidents per passenger boardings and train kilometres were significantly lower for 2007/08 compared to 2006/07.
The 2007/08 showed a reduction in incidents as a result of PTA’s risk management initiatives and controls. PTA’s normalized figures for the year 2007/08 were considerably reduced and could be attributed to an improvement in safety performance and the increase in patronage and kilometres as a result of the introduction of Mandurah Line with level crossings designed out of the system to reduce the risk.
Regional school bus services safety
Accidents attributable to all causes are notified to the School Bus Team Leader Vehicle Inspector in the PTA. The performance measure is expressed as the number of notifiable occurrences (accidents) reported during the school year. A low number of occurrences incidents indicates that sound safety procedures and controls exist and are being adhered to throughout the regional school bus fleet.
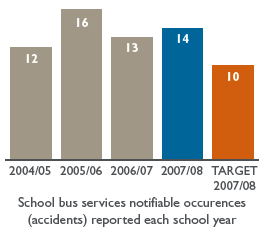
There were 14 ‘on-road’ school bus accidents recorded to date, comprising of 5 major and 9 minor accidents. Approximately 64% of the accident cases occurred through no fault of the school bus driver. No fatalities were recorded.
