Metro
Transperth is the brand and operating name of the public transport system in the greater metropolitan area of Perth.
The Transperth system consists of a bus network, a fully-electrified urban train system and a ferry service. It is managed by the Transperth branch of the Transperth System, Regional and School Bus Services (TRSBS) division and covers key functions such as system planning, bus service delivery, bus service security, passenger information services, ticketing, and bus fleet procurement.
Transperth bus and ferry services are provided under commercial contract arrangements; train services are provided by PTA’s Transperth Train Operations (TTO) division under an internal service level agreement.
Passenger information comprising InfoCentre, InfoLine and customer feedback services are provided under contract by Serco.
Fleet
TTO operates an electrified suburban train system with more than 1045 services on an average weekday and more than 6645 weekly services. At June 30, TTO operated a fleet of 243 railcars which can be coupled in configurations of two, three, four or six-car trains.
The system covers 173.1km of track with 70 stations on five lines. The network consists of the Joondalup Line (33.2km), the Fremantle Line (19km), the Midland Line (16km), the Armadale/Thornlie Line (30.5km and a 3km spur line to Thornlie), and the Mandurah Line (71.4km).
At June 30, the 1354-vehicle Transperth bus fleet was made up of 809 diesel buses (including 303 new buses delivered under the current Volvo contract) and 545 CNG buses. Of these, 347 buses (25.6 per cent of the fleet) conform to the Euro5 emissions standard, and 498 (36.8 per cent) meet the Euro4 standard. The 303 new Volvo buses meet the Euro5 EEV (enhanced environmentally friendly vehicle) standard. The Volvo contract will deliver 792 new diesels over an eight-year period.
In 2013-14, the Transperth bus system operated 289 standard timetabled bus routes and 309 school routes. On a typical weekday this involved 14,253 standard and 309 school service trips. Accessible buses are always used on 166 standard routes. A bus service frequency of 15 minutes or better is provided all day on most major corridors, with higher frequencies in peak periods.
The Transperth bus service network is divided into 11 geographic contract areas which are periodically subject to competitive tender. At June 30, three contractors operated Transperth bus services:
- Path Transit: Kalamunda, Morley.
- Swan Transit: Canning, Claremont, Marmion, Midland (including Midland shuttle), and Southern River.
- Transdev: Fremantle (including Fremantle CAT), Joondalup (including Joondalup CAT), Rockingham-Mandurah, and the Perth CAT contract.
Two ferries (MV Phillip Pendal and MV Shelley Taylor-Smith) operate the Transperth ferry service between the city (Barrack Street) and South Perth (Mends Street). The service is operated under contract by Captain Cook Cruises.
On an average summer (September to April) weekday, there are 92 ferry trips; on an average winter (May to August) weekday there are 60.
Following an increase in the maximum number of passengers allowed to be carried on CNG buses, the average capacity of the bus fleet increased to 78.482 in 2013-14 (77.463 in 2012-13 and 74.872 in 2011-12). Given that CNG buses account for 40.3 per cent of the fleet, total capacity jumped 5.6 per cent to 4970.3m passenger place km, from 4708.3m in 2012-13. This represents a marked increase from 2009-10 when the total capacity was 3677m.
The PTA continued to operate one diesel- electric hybrid bus on Perth City CAT services. The hybrid bus was commissioned in February 2013 by Volvo Bus Australia and was brought into service in March 2013. It is undergoing an 18-month trial and assessment to help shape future hybrid bus strategy. During the trial it will operate on all Perth CAT routes and its performance is being assessed against standard Volvo diesel buses and Mercedes CNG buses operating in the same environment.
In the year under review, we continued planning for the installation of the platform detection system on B-series railcars. This system promotes passenger safety – railcar doors will not open if there is no platform alongside the stationary railcar.
We again successfully provided train and bus services for various special events – including Skyshow, football and other sporting events, and concerts.
We also continued with the implementation of the bus service expansion program which began in 2011-12, with service improvements prioritised as follows:
- Services which cannot pick up passengers due to overloading.
- Transport corridors we identified as providing access between key primary and secondary centres to help achieve planned land-use outcomes proposed by the Department of Planning in Directions 2031.
- New urban areas developing on the fringes of the metropolitan area.
The bus service expansion program added 2.548 million service kilometres during the year to deliver a total of 63.329m km, up 4.2 per cent from 60.781m in 2012-13. This followed increases of 4.6 per cent in 2012- 13 and 8.5 per cent in 2011-12.
New service routes introduced during the year included:
- 950 (Superbus) between Morley bus station, QE11 Medical Centre and UWA via Perth.
- 990 between Scarborough Beach and Perth via Glendalough Station.
- 593 between Mandurah Station and Dawesville.
- 512 between Murdoch Station and Spearwood.
- 567 between Warnbro Station and Baldivis South.
Service extensions and improvements included:
- Extension and improved frequency of Route 40 to service Perth Airport Terminals T3 and T4 via Great Eastern Highway.
- Improved frequency of Canning Highway Routes 106 and 111.
There were also a number of significant new developments during the year.
- PTA took delivery of the first nine railcars (three, three-car trains) of the 66 B-series railcars on order.
- Completed upgrade of the railcar simulator which is used to train new drivers and for on-going review of driver performance.
- Implemented operational and timetable changes following the sinking of the Fremantle Line (part of the Perth City Link project).
- Started on a new contract with Synergy for the supply of electricity.
- Prepared detailed operational schedules and commenced recruiting of staff for the extension of the Joondalup Line to Butler station.
- Assisted with planning for the new Aubin Grove station and Burswood Stadium.
- Assisted with planning for the July 1, 2014 implementation of paid parking at all train stations.
- Opening of Roe Street temporary bus station in the city to allow for the construction of the new Perth Busport as part of the Perth City Link project.
- Completion of bus priority measures at Beaufort Street, William Street, Manning Road/Lawson Street, and Cockburn Central Station.
Network patronage
Patronage by mode is reported in four categories:
- Fare-paying boardings – cash and paid SmartRider boardings plus special event boardings.
- Cash and SmartRider initial boardings – fare-paying boardings plus free travel on SmartRider.
- Total initial boardings - cash and SmartRider initial boardings plus free travel on Free Transit Zone (FTZ) services, Central Area Transit (CAT) services in Perth, Fremantle and Joondalup, and the Midland Shuttle service.
- Total boardings – total initial boardings plus transfer boardings.
Free travel on SmartRider refers to travel by WA seniors, aged and disability pensioners and carers on weekdays from 9am to 3.30pm and all day on weekends and public holidays; all day free travel by veterans and PTA current and some retired staff; and train travel within the FTZ (available only to SmartRider users).
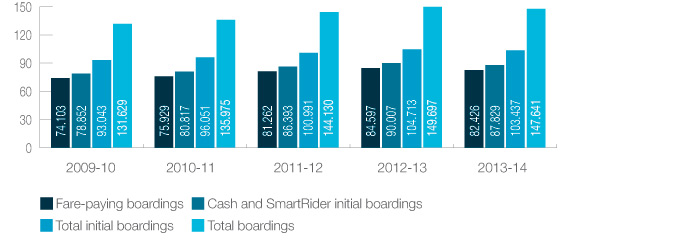
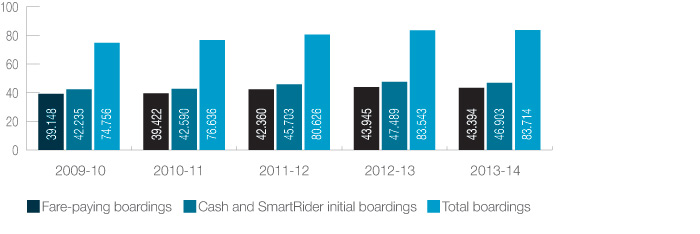
For the first time in many years, patronage on the Transperth system decreased in 2013-14. Total boardings fell 1.4 per cent to 147.6 million, total initial boardings fell 1.2 per cent to 103.4m, cash and SmartRider initial boardings fell 2.4 per cent to 87.8m, and fare-paying boardings fell 2.6 per cent to 82.4m.
A number of factors contributed to the decline:
- The partial shutdown of train services for 11 days in July and August 2013 to carry out major works associated with the Perth City Link project resulted in the loss of more than one million train boardings over the period with a flow-on impact on bus boardings.
- Work on many of the major road projects which had caused significant congestion in 2012-13 were completed this year. The improved roads allowed a much freer flow of traffic and provided an attractive alternative to public transport. Consequently, there could have been reluctance on the part of some passengers to return to public transport even after bus and train services were fully restored.
- Though key arterial roads were clearer, construction-related road works in the city remained an issue, as did traffic changes and general congestion – all of which affected bus reliability.
- A number of major business shutdowns or staff retrenchments in the CBD, which would have had an adverse impact on commuter patronage.
- A slowing of the rate of growth in population, particularly interstate migration, following the easing of the investment phase of the mining boom.
- Cost of living pressures impacting largely on discretionary travel.
- Stabilisation of fuel prices allowing motorists to become comfortable with the higher cost.
- To accommodate the new 950 high-frequency “Superbus” service, 5km of bus lane was built on Beaufort Street.
- New bus lanes and stops on William Street, Perth.
- Bus priority queue-jump lane at the Manning Road/Lawson Street intersection in Wilson.
- A bus-only connection from Cockburn Central Station through the Cockburn Gateway shopping centre
- 148 million metro boardings
- 64 million bus service kilometres delivered in metro area
- Introduction of digital cameras into the CCTV system.
- Improving our overhead line codes of practice to bring them in line with world best practice.
- Improvements to our training facility to ensure our staff can be trained in a safe environment.
- Start operations to Butler Station on the Joondalup Line.
- Introduce feeder bus services to support the new station at Butler.
- Continue to take delivery of the new B-series railcars and introduce them into service.
- Cascade A-series railcars from the Mandurah and Joondalup lines to bolster services on the Fremantle, Midland and Armadale lines.
- Purchase a diesel locomotive to help with line maintenance work.
- Undertake a major upgrade of the rail scheduling software.
- Continue to recruit staff for the provision of safe, reliable and customer-focused services.
- Introduce paid parking at all train stations.
- Introduce the new Route 930 between Esplanade Busport and Perth Airport Terminals T1 and T2.
- Invest in routes across the network to improve reliability and legibility.
- Introduce new bus priority measures:
- New bus lanes on Stirling Highway near UWA.
- Bus priority queue-jump lane at the Albany Highway intersection with Nicholson Road.
- Planning and detailed design of a bus priority route from the Esplanade Busport to the Point Lewis Rotary to accommodate buses travelling west from the Perth CBD.
- Worked with stakeholders to integrate proposed rail station precincts with planned town and city developments (most notably at Yanchep) in planning to extend the Joondalup Line from Butler to Yanchep, and to extend the Thornlie Line to Cockburn Central.
- Preparation of draft PDPs to extend the railway from Butler to Yanchep and from Thornlie to Cockburn Central.
- Preparation of priority listing for the closure or grade separation of level crossings on the suburban rail network.
- Review/derivation of rail patronage to 2031 and beyond resulting from increasing population growth as a prelude to developing an operational strategy and assessing ultimate capacity of the existing systems, and then forecasting future infrastructure and rollingstock requirements.
- Preparation of a business case on possible grade separation of Nicholson Road level crossing at Thornlie.
- Support of the business case and PDP for the Forrestfield-Airport Link (FAL) project.
- Preparation of preliminary railway alignments and engineering to extend the Joondalup Line from Butler to Yanchep, and to extend the Thornlie Line to Cockburn Central.
- Conceptual through to detailed design of turnback and crossover facilities at key locations on the suburban rail network as part of a program to provide greater operational reliance in the event of unplanned interruptions and system failures.
- Preparation of detailed railway engineering designs and layout of facilities to support the new Perth Stadium.
- Finalisation of detailed railway designs and “as constructed plans” for the Butler Extension Project (BEP).
- Provision of railway engineering expertise and oversight for the design and construction of railway works as part of the Esperance Port Access Corridor Project (managed by Main Roads WA).
- Provision of railway engineering expertise to the Department of Planning, in the development of an alternative alignment for the freight railway route from Bellevue to Forrestfield.
- Provision of preliminary concept route drawings in support of planning of future extensions and additions to the suburban railway network.
- Awarded a $4.3m tender for property management services over the next five years.
- Generated approximately $16m from leased properties.
- Finalised development of a Geographical Information System (GIS) to facilitate land management.
- Attended to the management of a number of residual issues associated with the leased freight corridor at Kewdale, Forrestfield and a number of country locations.
- Realised more than $1.7m from disposal of surplus land.
- Initiated an audit of non-rail assets in the leased freight corridor.
- Completed the purchase of the land for the new station at Aubin Grove.
- Completed purchase of land for Butler Station.
- Provided ongoing expertise to acquire the land required for the new Perth Stadium rail and bus facilities, and for Forrestfield-Airport Link.
- Provided major environmental input for the new Perth Stadium project, for the stadium itself and for the transport facilities, especially those associated with the proposed extensive railway infrastructure .
- Supported Forrestfield-Airport Link through the secondment of dedicated staff to the project, as well as additional support as required.
- Provided environmental services to support the BEP.
- Managed the environmental matters to ensure relevant clearances would be obtained in a timely manner to start construction of a new station at Aubin Grove.
- Managed a significant expenditure for the identification, reporting, and treatment of contaminated sites within the PTA’s operational and residual land assets.
- Provided support to the operations of the suburban passenger network and freight operations on the leased corridor by attending to environmental impacts (such as noise and vibrations).
Against this, free travel by seniors, aged/disability pensioners and carers rose. They accounted for 8.6m total boardings, up 1.7 per cent from 2012-13’s 8.4m – though there was a small drop in initial boardings. The bus number was up 1.1 per cent at 5.8m and the train figure was up three per cent at 2.7m.
Despite this year’s overall decline, patronage is still higher than it was in 2011-12, and considerably ahead of the levels of five years ago.
Transperth: Patronage (millions)
Transperth: Passenger place kilometres (millions)
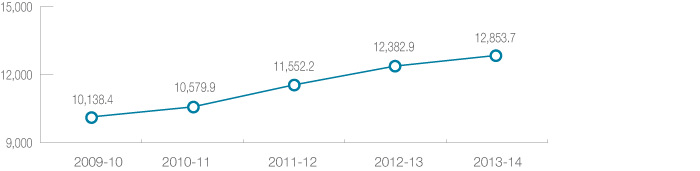
Passenger place kilometres represent the carrying capacity of the Transperth bus, train and ferry network. This metric is based on service kilometres and the average capacity of the fleet, and has been increasing steadily in recent years as new buses and trains come on stream and our networks expand.
Patronage profile
Fare-paying boardings (including special events) accounted for 56 per cent of total boardings in 2013-14 compared with 57 per cent in 2012-13; free travel accounted for 14 per cent (13 per cent) and transfers for 30 per cent (unchanged).
SmartRider accounted for 72 per cent of fare-paying boardings (including special events), up from 70 per cent in 2012-13. Cash boardings made up 26 per cent (28 per cent) and special events two per cent (unchanged).
Excluding special events, standard fare passengers accounted for an unchanged 54 per cent of cash and paid SmartRider boardings, concessions 32 per cent (unchanged) and students up to year 12 were 12 per cent (11 per cent in 2012-13), while FamilyRider numbers slipped slightly (two per cent, from three per cent).
Free travel on Transperth services comprises SmartRider-based free travel by seniors, aged/disability pensioners and carers which is electronically recorded on all modes, free travel on passes (manually recorded on bus and ferry but not recorded on train), and travel within the FTZ and on CAT and Midland Shuttle services.
Boardings on FTZ and Perth CAT services are estimated based on surveys carried out at regular intervals by independent consultants; boardings on Fremantle and Joondalup CAT services and on the Midland Shuttle service are reported by the bus contractors operating these services.
Transfers by SmartRider users accounted for 78 per cent of total transfers in 2013-14, up from 75 per cent in 2012-13.
Buses
Despite the various factors impacting adversely on Transperth patronage in 2013-14, total boardings on bus services edged up 0.2 per cent to 83.714m, but cash and SmartRider initial boardings, and fare-paying boardings all fell. As was the case system-wide, all the numbers were still well up on 2011-12.
Transperth buses: Patronage (millions)
Total boardings by contract area were:
| Contract area | 2013-14 | 2012-13 | Change |
|---|---|---|---|
| Kalamunda | 7.580m | 7.969m | -4.9% |
| Morley | 11.399m | 11.175m | 2.0% |
| Canning | 8.399m | 8.430m | -0.4% |
| Claremont | 4.373m | 4.536m | -3.6% |
| Marmion | 7.629m | 7.749m | -1.5% |
| Midland | 2.409m | 2.415m | -0.2% |
| Southern River | 3.918m | 3.822m | 2.5% |
| Fremantle | 9.551m | 9.911m | -3.6% |
| Joondalup | 7.171m | 7.150m | 0.3% |
| Rockingham | 6.147m | 6.234m | -1.4% |
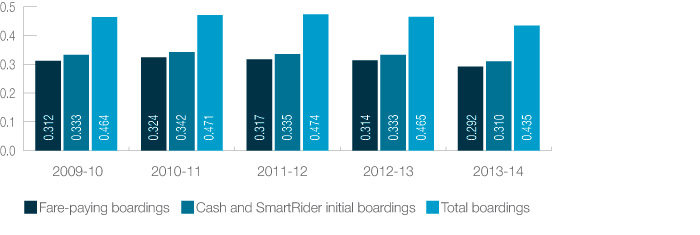
Average boardings on the bus system fell because the rate of change in actual boardings was below the 4.2 per cent increase in service kilometres – total boardings per service kilometre fell 3.8 per cent, from 1.375 in 2012-13, to 1.322.
Road congestion, particularly at peak, and a lack of significant bus priority measures on major roads impacted service reliability which, in turn, adversely affected bus patronage.
To address this, the PTA’s Bus Priority Program completed a number of initiatives in 2013-14, at a cost of $6.2 million:
Trains
Following a long period of uninterrupted growth, patronage on our trains fell – total boardings were down 3.3 per cent at 63.5m.
The decline was primarily due to two, Perth Station-based partial shutdowns (11 days in all) of the rail system in July and August of 2013 to allow for work associated with the Perth City Link project, plus several other factors noted earlier.
Transperth trains: Patronage (millions)
Cash and SmartRider initial boardings (including free travel on SmartRider but excluding free train travel within the FTZ) fell 3.7 per cent and fare-paying boardings fell four per cent.
| Line | 2013-14 | 2012-13 | Change |
|---|---|---|---|
| Armadale Line | 9.176m | 9.668m | -5.1% |
| Fremantle Line | 8.285m | 8.866m | -6.6% |
| Joondalup Line | .897m | .450m | -3.2% |
| Mandurah Line | 20.664m | 21.150m | -2.3% |
| Midland Line | 6.646m | 6.689m | -0.6% |
The slide in boardings combined with the increase in service kilometres resulted in average boardings recording a significant decline. Total boardings per service kilometre fell 7.4 per cent, from 4.117 in 2012-13, to 3.814. The cash and SmartRider initial boardings number was down 7.7 per cent at 2.440.
Ferries
The ferry service represents only a very small proportion of Transperth system patronage (less than 0.5 per cent). Fluctuations in the tourism market have a significant impact on ferry boardings, with tourists accounting for about half.
Transperth ferries: Patronage (millions)
In 2013-14, ferry total boardings fell 6.4 per cent, from 0.465m in 2012-13, to 0.435m. Cash and SmartRider initial boardings were down 6.9 per cent and fare-paying boardings down 7.1 per cent.
Average boardings also fell. Total boardings per service kilometre were down 5.9 per cent at 11.995, while cash and SmartRider initial boardings fell 6.4 per cent to 8.563.
Capacity
Total capacity on the Transperth system increased by 3.8 per cent – a slower rate of growth than in the previous three years. This continued rise has been driven mainly by the expansion of bus services resulting in passenger place kilometres on the bus network increasing by 16.5 per cent in 2011-12, 8.1 per cent in 2012-13 and 5.6 per cent in 2013-14.
Reliability
Transperth uses technology-based monitoring methods which allow precise data-gathering to measure On-Time Running (OTR). On bus and ferry services, OTR is measured using GPS information functions in SmartRider, while the train control system is used to measure train OTR.
Transperth: Service reliability by mode
Proportion of service meeting on-time targets (per cent)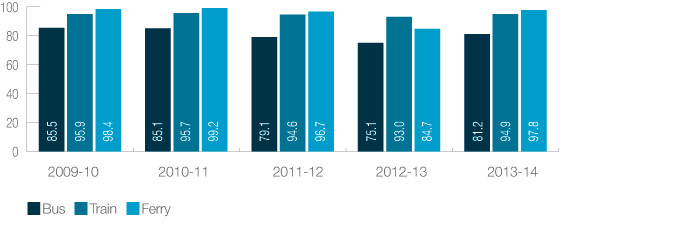
Transperth trains
The service reliability target for Transperth trains is for 95 per cent of services to arrive within four minutes of the scheduled time. Until 2006-07, this tolerance margin was three minutes. It changed in 2007-08 to take account of the longer train journeys and increased journey times, and to ensure national consistency in reliability measures.
In 2013-14, 94.9 per cent of train services met the target.
Transperth buses
The service reliability target for Transperth buses is for 75 per cent of services to arrive at timing point within four minutes of the scheduled time, and never leave a terminus, or travel through a mid-way timing point early.
Reliability is monitored through a random sample of one per cent of trips in each bus contract area using the GPS information functions in SmartRider which provides an accurate assessment of bus on-time performance. The one per cent sample is substantial given that there are more than 14,500 bus trips on a typical weekday. GPS information functions help to identify under-performing services which, after a careful review, can be re-scheduled to ensure improved performance.
In 2013-14, Transperth buses recorded a significant improvement in service reliability with OTR increasing to 81.2 per cent from 75.1 per cent in 2012-13. This was brought about largely through the restoration of normal operations following the completion of many of the major arterial road works which had impacted adversely on bus services during 2012-13.
Transperth ferries
The service reliability target for the ferry service is for 85 per cent of services to arrive within three minutes of the scheduled time. On average, 97.8 per cent of services met the target in 2013-14. Activity on the river associated with the work on Elizabeth Quay was less disruptive during the year and allowed the ferry service to achieve a higher level of service reliability.
Maintenance
The Network and Infrastructure (N&I) Division is responsible for the asset management of the urban passenger rail network, the asset investment program (with the exception of major projects) and the delivery of information technology services.
N&I has a service level agreement with Transperth Train Operations (TTO) which details its responsibility for the provision and maintenance of the infrastructure required to operate train services reliably, efficiently and safely.
Most of the Division’s resources are allocated to maintenance, both planned and breakdown. Routine maintenance is planned carefully to ensure the infrastructure is safe and highly reliable. This ensures that our customers continue to enjoy a safe and dependable train service. The Division also deploys its resources to ensure a rapid response to any breakdowns to minimise delays and customer impact.
The rail network’s 70 stations are highly visible infrastructure assets. As well as ensuring that all station facilities are reliable, considerable effort is made to have them well presented. This is achieved through regular cleaning and periodic large maintenance items such as high-pressure water cleaning and painting.
Most of the work undertaken in this area remains unseen by the public. However the impact on our customers if the infrastructure fails is significant, so our focus this year has been on servicing and improving all aspects of our business. This has resulted in a number of changes, including:
Upgrades
A program to improve the reliability and disability access of lifts and escalators started in 2014, and replacement of the assets at Warwick Station has been completed. Work will now start at Perth Station and five stations on the Joondalup Line, through until May 2016. The program will deliver bigger lift cars and wider doors to cater for people with disabilities in accordance with DDA requirements.
Upgrades were completed on the public address system at Whitfords and Warwick stations, so that information is more intelligible to passengers. Stirling is due for completion in July 2014.
The technology infrastructure supporting the Transperth website has been upgraded to provide increased reliability and improve performance for users of the website.
Traction power supply strengthening at the Edgewater and Summers Street feeder stations allows for increases to the capacity of the rail network.
Major initiatives
In 2014-15, we will:
Infrastructure Planning and Land Services
IPLS provides the PTA with professional resources to support and undertake major planning and business objectives, railway engineering, and land and environmental management.