- Home
- Operational Report
- Fares and other revenue
Fares and other revenue
Metro
Transperth applies a common fare structure across its integrated bus, train and ferry service network. Fares are based on a zonal system with nine concentric bands. Travel within zone one covers a distance of 8km, zones two and three each cover 9km, and zones four to nine cover 10km each.
Fares are set for travel in a specified number of zones. A short-distance fare is available for trips of up to 3.2km (two sections). Students up to Year 12 pay a flat fare for all travel during the gazetted school year except on weekends. In addition, there are multi-trip daily tickets for individuals (DayRider) and groups (FamilyRider).
Passengers are able to transfer between services and modes without extra charge, within two hours on journeys of up to four zones and within three hours on journeys of between five and nine zones. This free transfer facility is available on the two-section fare only if the transfer can be made without a break in the journey and if the boarding and alighting points are within one section of the zone boundary or within one section of the transfer point.
The cash fares schedule for 2013-14 is shown below.
Transperth cash fares schedule 2013-14
| Standard | Concession | Other | |
|---|---|---|---|
| 2 Sections | $2.00 | $0.80 | |
| 1 Zone | $2.80 | $1.10 | |
| 2 Zones | $4.20 | $1.70 | |
| 3 Zones | $5.10 | $2.00 | |
| 4 Zones | $6.10 | $2.40 | |
| 5 Zones | $7.50 | $3.00 | |
| 6 Zones | $8.50 | $3.40 | |
| 7 Zones | $9.90 | $4.00 | |
| 8 Zones | $10.70 | $4.30 | |
| 9 Zones | $11.60 | $4.60 | |
| DayRider | $11.60 | $4.60 | |
| FamilyRider | $11.60 | ||
| Student (a) | $0.50 | ||
| 24 Hour SmartRider (b) | $4.90 | ||
| Unrestricted half-yearly (c) | $94.60 | ||
| Unrestricted monthly (c) | $15.80 |
- a) Available only as a SmartRider. Valid for all travel on Transperth services from Monday to Friday from the first to the last gazetted school day of the year; during mid-year school term holidays; and on public holidays that fall on a weekday during the school year.
- b) Only sold to welfare agencies to be given to their clients.
- c) Only available to persons receiving the disability support pension and employed in a supported employment setting. Persons receiving the disability support pension but not employed in a supported employment setting may apply for this ticket if they satisfied specified criteria.
Discounts on cash fares are provided through the SmartRider system and are based on the reload method used. A discount of 25 per cent is available to users choosing Autoload through direct debit or credit card. People who choose other reload methods – such as BPay, add-value machines, on-board bus or ferry, and at retail sales outlets and InfoCentres – receive a 15 per cent discount from the relevant standard cash fare.
SmartRider leads Australia in smartcard ticketing technology and continues to increase its proportion of fare-paying boardings on the Transperth network. It provides a complete and accurate record of SmartRider boardings because users are required to tag on and tag off on smartcard processors on buses and ferries and at train stations. The 2014 PSM showed that 97 per cent of passengers (bus, train and ferry) are happy with SmartRider.
Ticketing facilities provided for passengers who choose to pay cash for their travel are electronic ticket-issuing machines on all buses and ferries, and ticket-vending machines at train stations and ferry jetties.
Fare-paying boardings (including special events) accounted for 56 per cent of total boardings, compared with 57 per cent in 2012-13. Free travel made up 14 per cent (previously 13 per cent) and transfers were unchanged at 30 per cent.
SmartRider accounted for 72 per cent of fare-paying boardings (up from 70 per cent in 2012-13), cash boardings for 26 per cent (28 per cent) and special events for two per cent (unchanged).
Excluding special events, standard-fare passengers accounted for a steady 54 per cent of cash and paid SmartRider boardings (no change from 2012-13), concessions 32 per cent (also unchanged), students to Year 12 were 12 per cent (11 per cent previously), and FamilyRider two per cent (three per cent ).
Free travel on Transperth services comprises SmartRider-based free travel by seniors, aged/disability pensioners and carers which is electronically recorded on all modes, free travel on passes (manually recorded on bus and ferry but not recorded on train), and travel within the FTZ and on CAT and Midland Shuttle services.
Boardings on FTZ and Perth CAT services are estimated based on surveys carried out at regular intervals by independent consultants; boardings on Fremantle and Joondalup CAT services and on the Midland Shuttle service are reported by the contractors.
Transfers by SmartRider users accounted for 78 per cent of total transfers, up from 75 per cent in 2012-13.
- SmartRider made up 72% of fares
- 97% SmartRider satisfaction
Revenue and expenditure
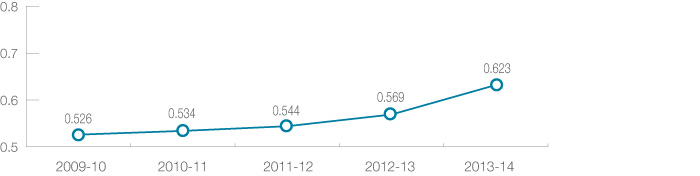
In 2013-14, the average total cost (including capital charges) of providing Transperth services rose 9.6 per cent, from $0.569 per passenger kilometre in 2012-13, to $0.623. This was due to the 1.8 per cent decline in passenger kilometres, combined with an increase of 7.5 per cent in total system cost.
Transperth: Total cost per passenger kilometre
Passenger kilometres are calculated using the average trip length for each mode derived from SmartRider data. This process accurately records the length of each SmartRider journey including individual legs and transfers. This average trip length is then applied to cash fares to estimate transfers by cash passengers. Estimated trip lengths are applied to boardings on bus services in the FTZ and on CAT and Midland Shuttle services. Free train travel within the FTZ which is available only to SmartRider users is recorded on the SmartRider system.
Transperth: System expenditure ($ millions)
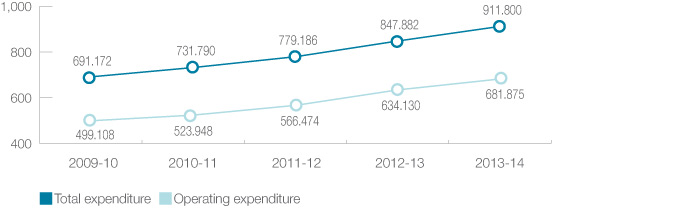
Total expenditure on Transperth services rose 7.5 per cent, from $847.882m in 2012-13, to $911.8m. Operating expenditure (excluding annual capital charges) also went up 7.5 per cent, to $681.875m.
Across the modes, total expenditure increased 6.1 per cent on bus, 8.9 per cent on train and 13.3 per cent on ferry. Operating expenditure increased 7.4 per cent on bus, 7.7 per cent on train and 14.7 per cent on ferry.
Transperth: System revenue ($ millions)
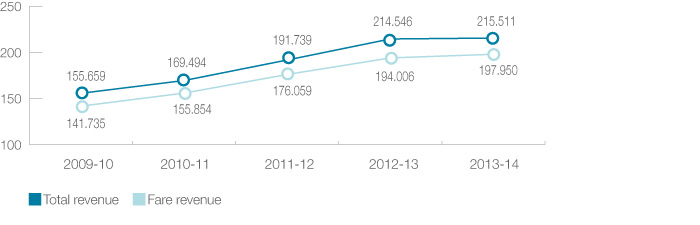
Transperth revenue continued to increase, but at a much lower rate. Total revenue (which includes income from parking, advertising, rent, etc) increased by 0.4 per cent, from $214.546m in 2012-13, to $215.511m. This fractional increase compares with jumps of 11.9 per cent, 13.1 per cent and 8.9 per cent previously.
Fare revenue edged up from $194.01m in 2012-13, to $197.95m – the two per cent increase compares with double-figure growth in each of the three preceding years. Fare revenue sources includes cash tickets and SmartRider paid boardings, full or part funding for CAT services, funding contributions for the provision of specific bus services, revenue from joint ticketing for special events (where the public transport fare is included in the price of the event ticket), Commonwealth funding for concession travel by interstate seniors, and income from the sale of SmartRider cards.
A new fares schedule effective from July 1 2013 provided for an overall weighted average increase in fares of 4.3 per cent, with standard fares rising by an average of 4.7 per cent and concession fares (which are set at 40 per cent of standard fares) by an average of 3.2 per cent. The student fare remained unchanged at 50c for all travel on Transperth services during the school year except on weekends.
Fare-paying boardings (cash, SmartRider and special events) across the system fell 2.6 per cent, from 84.60m in 2012-13, to 82.43m. This compares with a 4.1 per cent increase in 2012-13 and primarily reflects the July-August train shuts.
Despite lower numbers of fare-paying boardings, bus and train fare revenue rose 3.7 per cent (to $82.81m) and 1.2 per cent (to $113.22m). On the ferry, fare revenue fell 3.8 per cent to $481,000.
Costs of the service
On a per capita basis, public transport usage within the Perth metropolitan area (including the City of Mandurah) was 53.4 initial boardings compared with 54.2 in 2012-13. This reflects the fall in patronage, exacerbated by an increase in population.
In 2013-14, the total cost of providing Transperth train services, including annual capital charges, was up 8.9 per cent, from $428.03m in 2012-13, to $466.25m. Annual capital charges (interest and depreciation) rose 11.1 per cent to $170.32m.
Train operating costs – direct operating costs and transfer expenses (infrastructure maintenance and corporate overheads) – rose 7.7 per cent to $295.92m. Direct operating costs increased 1.1 per cent to $181.118m in 2013-14 from $179.189m in 2012-13.
The total cost of operating Transperth bus services rose 6.1 per cent to $444.61m. Operating costs rose 7.4 per cent to $385.09m, while annual capital charges (interest and depreciation) fell 1.4 per cent to $59.52m from $60.35m.
- More than 153,000 downloads of the Transperth App
- More than 1 million customer inquiries received by Transperth InfoLine
Regional
Transwa
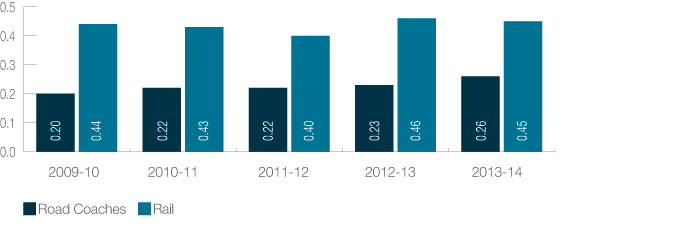
The average cost per coach passenger kilometre went up 12.61 per cent to $0.26; the corresponding rail figure went down 2.58 per cent to $0.45.
Transwa: Average cost per passenger kilometre ($)
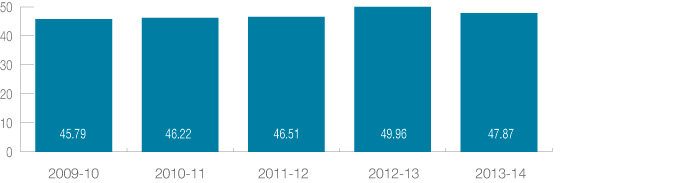
Revenue and expenditure
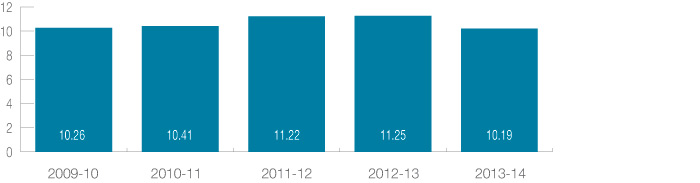
Revenue was down 10.41 per cent at $10.19m, reflecting a decrease in passenger numbers on all services except for the Merredinlink. Expenditure was also lower – down 4.37 per cent to $47.87m.
Transwa: Revenue ($ million)
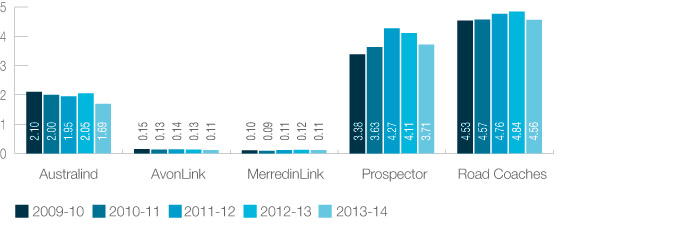
Transwa: Revenue by service ($ million)
Transwa: Expenditure ($ million)
Regional Town Bus Services
Cost of the service
The cost of operating regional town bus services in 2013-14 was $17.4 million, up 8.8 per cent from $16.0m in 2012-13. The cost of intra-town services increased 8.7 per cent from $15.0m to $16.3m, while the inter-town services cost increased 7.3 per cent from $979,493 to $1,050,602.