Metropolitan and regional
passenger services
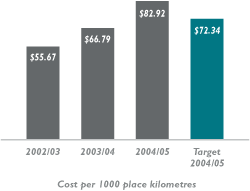
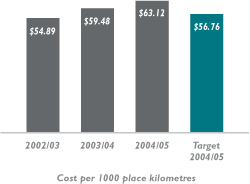
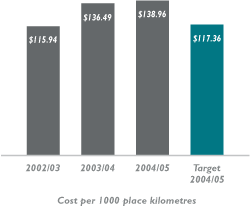
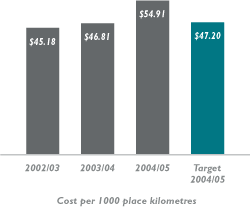
Cost per 1000 place kilometres
The cost efficiency of providing the service per place
kilometres is measured using the cost per 1000 place
kilometres.
Transperth Train Operations

Performance Indicators (Unaudited)
For the year ended 30 June 2005
Following the expansion of train services, passenger
kilometres increased by 6.0% in 2004/05. However, the
total cost of providing train services increased by
34.5% due largely to a significant increase in capital
charges associated with the long term investment in
the extension of the railway line both in the Northern
and Southern suburbs. Furthermore, as a result of the
service expansion, operating costs rose by 19.4%.
Transperth Bus Operations 
The variance is due to the 6.1% increase in bus total
costs combined with marginally lower passenger place
kilometres.
|
The increase in total costs was the result of both
higher capital charges (increase of 11%) following the
acquisition of new buses, and higher operating costs
(increase of 4.7%).The increase in the operating costs
was as a result of expenditure on security issues,
ticketing system maintenance, higher insurance and
vehicle licensing costs as well as bus stop and
infrastructure maintenance.
Transperth Ferry Operations

The actual 2004/05 cost per passenger kilometre is
significantly higher than the target for 2004/05 as a
result of the target being based on an underestimated
budget which did not reflect the total cost of operating
the ferry service.
Regional Bus Services

The actual for 2004/05 compared to the target is
higher as a result of a change in the basis of recording
the revenue and cost of the regional services. The
target has been calculated on costs net of revenue
while the actuals are on a gross basis for most services.
Excluding this anomaly there has been no significant
change in performance.
|

