TRANSPERTH TRAINS
DESCRIPTION OF SERVICES
Transperth Train Operations (TTO) operates an electrified suburban train system with more than 867 services on an average weekday and in excess of 5,488 services weekly.
At 30 June 2007, the system covered 101.7 kilometres of track with 59 stations on five lines, and a fleet of 189 railcars which can be coupled in configurations of two, three, four or six railcar trains.
The train network consists of the Joondalup Line (33.2km), the Fremantle Line (19.0km), the Midland Line (16.0km), the Armadale Line (30.5km) and the Thornlie Line (3.7km).
THE YEAR’S DEVELOPMENTS
- Major construction works were carried out on
the suburban rail network during the year:
- The New MetroRail (NMR) project continued focus on delivering the new Southern Suburbs Railway. Substantial works were carried out during the year including preparing for the move from the “build” stage to “operational and maintenance”. The NMR construction project is covered in more detail at the end of this section.
- A special events siding was built adjacent to the Daglish train station on the Fremantle Line to allow for the use of six-car trains to clear crowds from Subiaco Oval. The siding commenced operations in May 2007.
- The siding at nearby West Leederville
train station was improved by the addition
of a connection to the main line at the
south end. A new six-car platform
 was
constructed to service the improved siding
in readiness for the opening of the Southern
Suburbs Railway. The main platform at West
Leederville was also in the process of being
extended to accommodate six-car trains at
year’s end.
 - A comprehensive community consultation process was conducted for the Daglish and West Leederville projects.
- Station upgrades were completed at Grant
Street
 and Loch Street
 on the Fremantle Line.
The first stage of a major rebuild of Kelmscott
Station on the Armadale Line was completed.
 - Further work was completed along the Armadale Line in the $70 million program to replace timber sleepers with concrete ones on the whole suburban rail network.
- Contracts were awarded for the provision of an underfloor railcar wheel lathe at Nowergup and associated infrastructure works to ensure fast turnaround of railcars and provide the ability to machine wheels during the inter-peak period without affecting peak period passenger services.
- Programs to upgrade passenger information and
improve passenger safety continued during the
year:
- Installation began of the Customer Information System (CIS), a component of the PTA’s new train control system at existing terminal and bus/rail interchange stations, as well as at all stations on the new Mandurah Line. CIS provides passengers information on train services. It uses a combination of electronic displays and public address announcements. The station displays include information to enable bus drivers to better coordinate bus departures with train arrivals. The installation of the equipment commenced in May 2007 with completion planned for December 2007.
- A program to modernise passenger
information signage on train stations
 was
substantially completed during the year. The
new signs are more legible, consistent and
informative. The program will be completed
during 2007/08 with the renewal of signs at
Perth Station.
 - The Recording and Passenger Information
Dissemination (RAPID) system was installed
on 19 A-series* railcar sets (out of a total
A-series fleet of 48 railcar sets). RAPID
incorporates the latest in digital technology,
increases the number of railcar security
cameras, provides passenger information
displays
 in the railcars and provides
improved message announcements. It is
envisaged that the upgrade program will be
completed in 2009/10.
 - The Transit Guard position was re-titled “Transit Officer” and, for improved effectiveness, these staff were decentralised from Perth to each of the train lines. This resulted in better quality customer service as well as improved staff morale as the officers developed specific knowledge of the lines and associated customer needs.
- Following the introduction of SmartRider, selected larger stations became “closed” stations where passengers are required to pass through fare gates to enter and exit. During the year, 98 Passenger Ticketing Assistants were recruited to staff these fare gates and assist passengers. In addition, a new light, compact, hand-held smartcard reader (HSR) was developed for use by Transit Officers to check SmartRider cards.
- A new customer service branch was created within Transperth Train Operations to further improve customer service in anticipation of the increase in the customer base which will follow the opening of the Southern Suburbs Railway.
- During the year, Transperth Train Operations recruited and trained 105 new railcar drivers, mostly for deployment on the Southern Suburbs Railway. The training program consisted of approximately two months theoretical training in the class room and on a driving simulator, followed by over three months of on-the-job supervised in-cab training.
- The “Adopt a Station” program and the
“Right Track”
 program for school students
were launched on the Armadale Line. The
“Adopt a Station” program seeks to encourage
community ownership of the station to assist
in reducing incidents of vandalism. The “Right
Track” program, which is designed for students
in years 5 to 12, addresses issues of trespass,
vandalism and anti-social behaviour at train
stations and on trains.
 - Three new cash ticket vending machines
 (TVM) went on trial at Perth and Bayswater
train stations. The new machines provide a
touch screen display and can be configured to
accept coins, debit cards and notes in payment
of fares. The existing button-based machines
only accept coins.
*Transperth's first series of electric trains
COST OF THE SERVICE
The total cost of providing train services (inclusive of capital charges) increased 22.9% from $262.3 million to $322.3 million. Operating costs (excluding capital charges) rose from $106.9 million to $144.3 million, i.e. by 35.1%.
Between 2005/06 and 2006/07, the Capital User Charge increased by over 200% and accounted for over half of PTA’s total capital charges in 2006/07. The increase in operating costs was largely due to expenditure on recruiting and training train crews for the new railway and new Passenger Ticketing Assistants to be deployed at the “closed” stations which is an integral part of the new SmartRider ticketing system.
PATRONAGE
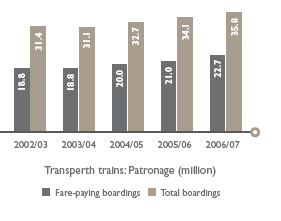
Patronage on Transperth train services recorded a substantial increase for the third year in succession. In 2006/07, fare-paying boardings rose 7.9% to 22.659 million from 21.002 million in 2005/06, while total boardings recorded a 4.8% increase to 35.758 million from 34.133 million.
The significant increase in fare-paying boardings in 2006/07 followed an increase of 6.3% in 2004/05 and 4.8% in 2005/06. This rapid growth in patronage occurred following the expansion of the train fleet and the increasing use of three- and six-car trains in 2006/07. The convenience of park and ride resulting from the 786 parking bays at Clarkson train station and 609 bays at Greenwood train station also helped to attract more patrons to the network resulting in fewer transfer boardings.
For total boardings (which includes transfers), the rate of increase continued at the rate of the previous three years.
Average boardings per service kilometre also increased in 2006/07, reversing the declining trend seen during the past three years. Between 2005/06 and 2006/07, fare-paying boardings per service kilometre increased from 2.581 to 2.695, i.e. by 4.4%, compared with the decline of 7.7% between 2004/05 and 2005/06. Total boardings per service kilometre increased from 4.194 to 4.253 (1.4%) between 2005/06 and 2006/07 while there had been a decline of 8.1% between 2004/05 and 2005/06. These changes were largely a result of service kilometres only increasing by 3.3% in 2006/07 compared with the 13.6% increase in 2005/06.

PASSENGER SATISFACTION
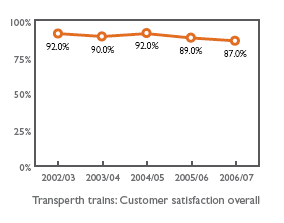
The Transperth Passenger Satisfaction Monitor 2007 showed that a significant proportion of users continued to be satisfied with the train system, although the proportion fell to 87% from 89% in 2006 and 92% in 2005. The table shows that the level of satisfaction with key service attributes was high. However, in the case of three specific attributes, the level of dissatisfaction was significant – 18% were dissatisfied with availability of seats, 13% with the number of trains during peak times and 10% with respect to the ease of (or lack of) access to ticket purchasing facilities.

The importance rating of the service characteristics of Transperth’s train services (other than passenger safety) and the level of satisfaction/dissatisfaction for each key service characteristic are shown in the table.
Passenger rating of characteristics of Transperth train services
SERVICE CHARACTERISTIC | IMPORTANCE RATING | SATISFACTION RATING | ||
| 2006 | 2007 | 2006 | 2007 | |
| Cost of fares | 70% | 74% | 68% (6%) | 64% (9%) |
| Speed of the trip | 66% | 73% | 92% (4%) | 91% (4%) |
| Punctuality of the train service | 71% | 69% | 87% (8%) | 88% (6%) |
| Cleanliness on board | 55% | 61% | 85% (5%) | 86% (5%) |
| Availability of seats | 53% | 60% | 78% (16%) | 74% (18%) |
| Number of trains during peak times | 52% | 56% | 81% (13%) | 81% (13%) |
| Number of trains during the day | 57% | 53% | 81% (5%) | 86% (5%) |
| Easy access to ticket purchasing facilities | – | 46% | – | 82% (10%) |
Note: Dissatisfaction level shown in parenthesis.
PASSENGER SAFETY
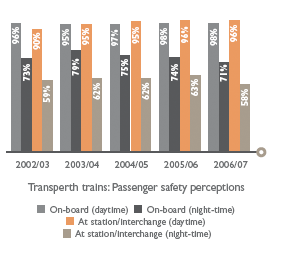
In the Passenger Satisfaction Monitor, train users were asked: “How safe do you generally feel from personal interference or threat from other passengers …?”
The graph shows the proportion of respondents who “always or usually feel safe” at the specified times/locations on the train network.
The results for the past five years show that the proportion of train passengers who generally felt safe on-board trains and at station/interchanges during the day has remained high. However, the proportion of train users who generally felt safe on-board at night continued to fall, from 79% in 2004 to 75% in 2005 and 74% in 2006 and 71% in 2007. There was also a significant decline, from 63% in 2006 to 58% in 2007 in the proportion of respondents who generally felt safe at station/interchanges at night.

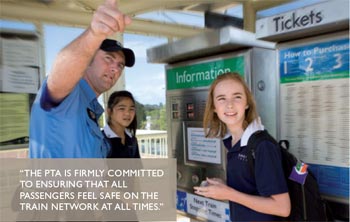
The PTA is firmly committed to ensuring that all passengers feel safe on the train network at all times. The centralised monitoring of digitised CCTV coverage at all stations via a state-of-the-art monitoring centre manned 24 hours a day continued during the year.

Transit Officers were trained in the use of oleoresin spray which was then issued to them. This spray is deterring some people from anti-social behaviour and allows potentially dangerous situations to be better controlled.
To address the issue of achieving full Transit Officer staffing, a very active recruiting program was undertaken during the year and a website was developed to assist in this program.
PLANNED MAJOR INITIATIVES FOR 2007/08
- Continue recruitment of additional staff to service customer needs on the new Southern Suburbs Railway.
- Commence operation of additional pay ’n’ display car parks at Clarkson, Greenwood and Thornlie, improving security at these locations.
- Continue rollout of Recording and Passenger Information Dissemination (RAPID) system into the A-series railcars,
- Complete installation of a wheel lathe at Nowergup,
- Complete installation of Customer Information System.


